

Padrões atuais

Padrões são modelos gráficos que são formados no gráfico pelo preço. Segundo um dos postulados da análise técnica, a história (movimento de preços) se repete. Isso significa que os movimentos de preços geralmente são semelhantes nas mesmas situações, o que possibilita prever o desenvolvimento futuro da situação com alta probabilidade.
Os padrões relevantes da InstaTrade são um serviço fácil de usar, que permite que você esteja ciente das últimas mudanças no mercado e reaja a indícios do mercado a tempo. Em nosso serviço, você sempre encontrará os padrões mais recentes e relevantes em qualquer par e em qualquer período gráfico.
Triple Top
was formed on 15.04 at 10:29:47 (UTC+0)
signal strength 3 of 5
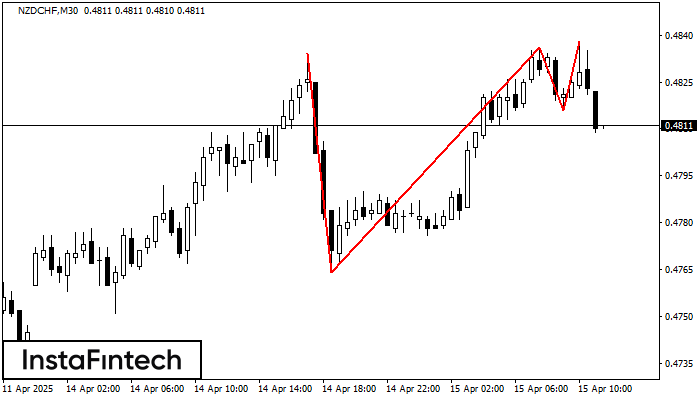
The Triple Top pattern has formed on the chart of the NZDCHF M30 trading instrument. It is a reversal pattern featuring the following characteristics: resistance level -4, support level -52, and pattern’s width 70. Forecast If the price breaks through the support level 0.4764, it is likely to move further down to 0.4806.
- All
- All
- Bearish Rectangle
- Bearish Symmetrical Triangle
- Bearish Symmetrical Triangle
- Bullish Rectangle
- Double Top
- Double Top
- Triple Bottom
- Triple Bottom
- Triple Top
- Triple Top
- All
- All
- Buy
- Sale
- All
- 1
- 2
- 3
- 4
- 5
Double Top
was formed on 23.05 at 13:15:25 (UTC+0)
signal strength 1 of 5
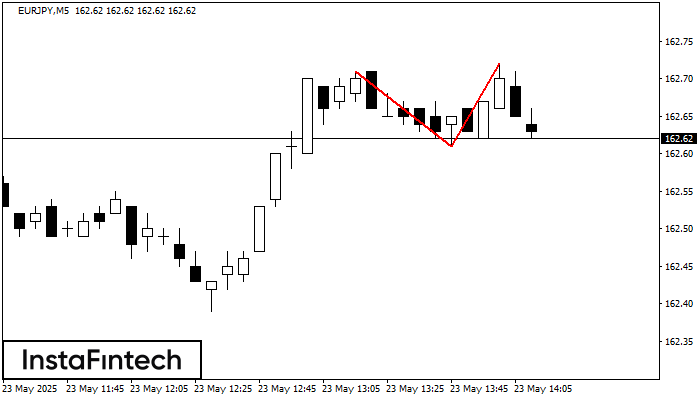
The Double Top reversal pattern has been formed on EURJPY M5. Characteristics: the upper boundary 162.71; the lower boundary 162.61; the width of the pattern is 11 points. Sell trades
The M5 and M15 time frames may have more false entry points.
Open chart in a new window
Double Top
was formed on 23.05 at 13:10:13 (UTC+0)
signal strength 1 of 5
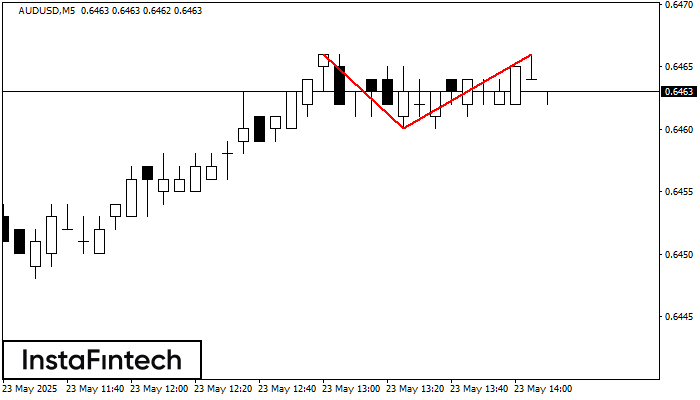
The Double Top reversal pattern has been formed on AUDUSD M5. Characteristics: the upper boundary 0.6466; the lower boundary 0.6460; the width of the pattern is 6 points. Sell trades
The M5 and M15 time frames may have more false entry points.
Open chart in a new window
Double Bottom
was formed on 23.05 at 12:59:46 (UTC+0)
signal strength 2 of 5
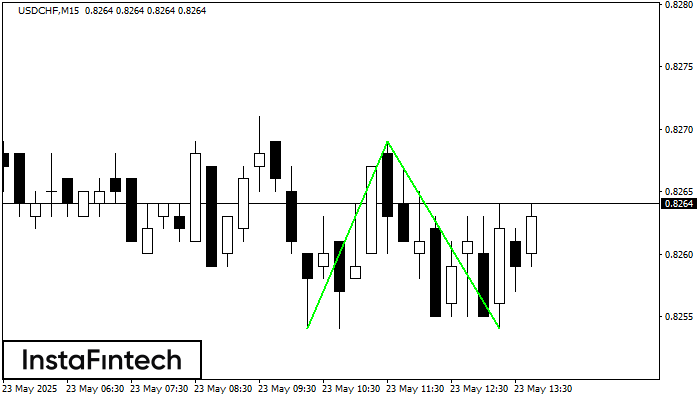
The Double Bottom pattern has been formed on USDCHF M15. Characteristics: the support level 0.8254; the resistance level 0.8269; the width of the pattern 15 points. If the resistance level
The M5 and M15 time frames may have more false entry points.
Open chart in a new window


