

Padrões atuais

Padrões são modelos gráficos que são formados no gráfico pelo preço. Segundo um dos postulados da análise técnica, a história (movimento de preços) se repete. Isso significa que os movimentos de preços geralmente são semelhantes nas mesmas situações, o que possibilita prever o desenvolvimento futuro da situação com alta probabilidade.
Os padrões relevantes da InstaTrade são um serviço fácil de usar, que permite que você esteja ciente das últimas mudanças no mercado e reaja a indícios do mercado a tempo. Em nosso serviço, você sempre encontrará os padrões mais recentes e relevantes em qualquer par e em qualquer período gráfico.
Double Top
was formed on 15.04 at 08:30:13 (UTC+0)
signal strength 3 of 5
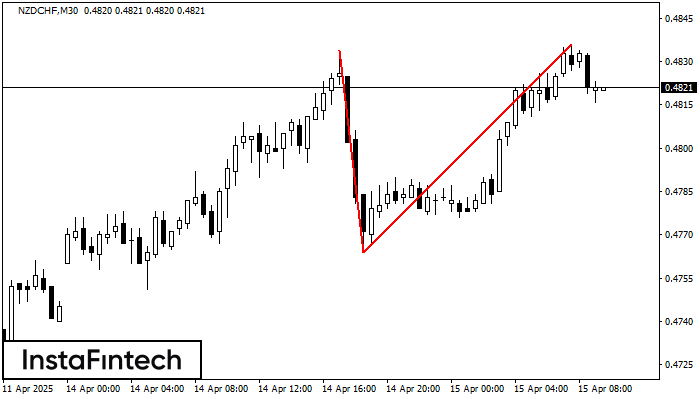
On the chart of NZDCHF M30 the Double Top reversal pattern has been formed. Characteristics: the upper boundary 0.4836; the lower boundary 0.4764; the width of the pattern 72 points. The signal: a break of the lower boundary will cause continuation of the downward trend targeting the 0.4734 level.
- All
- All
- Bearish Rectangle
- Bearish Symmetrical Triangle
- Bearish Symmetrical Triangle
- Bullish Rectangle
- Double Top
- Double Top
- Triple Bottom
- Triple Bottom
- Triple Top
- Triple Top
- All
- All
- Buy
- Sale
- All
- 1
- 2
- 3
- 4
- 5
Bandeira de Baixa
was formed on 16.05 at 05:10:45 (UTC+0)
signal strength 1 of 5
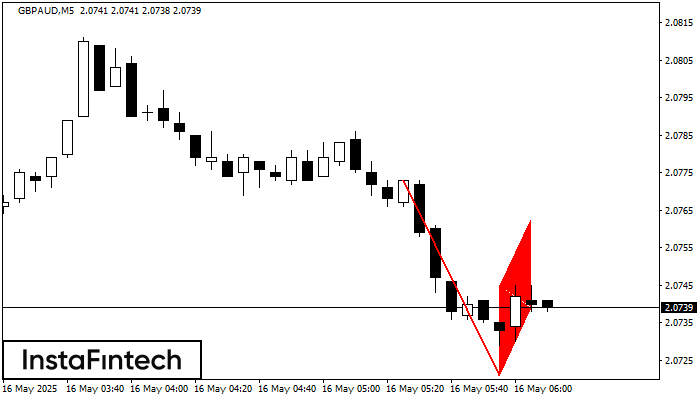
O padrão Bandeira de Baixa foi formado no gráfico GBPAUD M5, o que sinaliza que a tendência de queda continuará. Se o preço quebrar abaixo do mínimo em 2.0721, então
Os intervalos M5 e M15 podem ter mais pontos de entrada falsos.
Open chart in a new window
Pennant de baixa
was formed on 16.05 at 05:10:39 (UTC+0)
signal strength 1 of 5
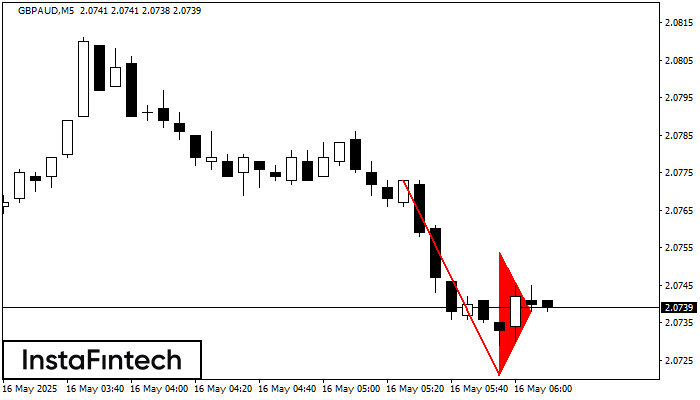
O padrão Pennant de baixa foi formado no gráfico GBPAUD M5. Ele sinaliza a continuação potencial da tendência existente. Especificações: o fundo do padrão tem a coordenada de 2.0721;
Os intervalos M5 e M15 podem ter mais pontos de entrada falsos.
Open chart in a new window
Retângulo de alta
was formed on 16.05 at 04:52:53 (UTC+0)
signal strength 1 of 5
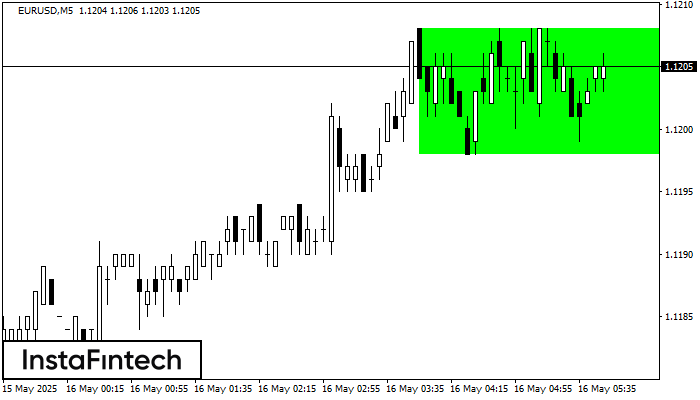
De acordo com o gráfico de M5, EURUSD formou o Retângulo de alta que é um padrão de uma continuação da tendência. O padrão está dentro dos seguintes limites
Os intervalos M5 e M15 podem ter mais pontos de entrada falsos.
Open chart in a new window


