

Padrões atuais

Padrões são modelos gráficos que são formados no gráfico pelo preço. Segundo um dos postulados da análise técnica, a história (movimento de preços) se repete. Isso significa que os movimentos de preços geralmente são semelhantes nas mesmas situações, o que possibilita prever o desenvolvimento futuro da situação com alta probabilidade.
Os padrões relevantes da InstaTrade são um serviço fácil de usar, que permite que você esteja ciente das últimas mudanças no mercado e reaja a indícios do mercado a tempo. Em nosso serviço, você sempre encontrará os padrões mais recentes e relevantes em qualquer par e em qualquer período gráfico.
Triple Top
was formed on 14.04 at 13:55:08 (UTC+0)
signal strength 1 of 5
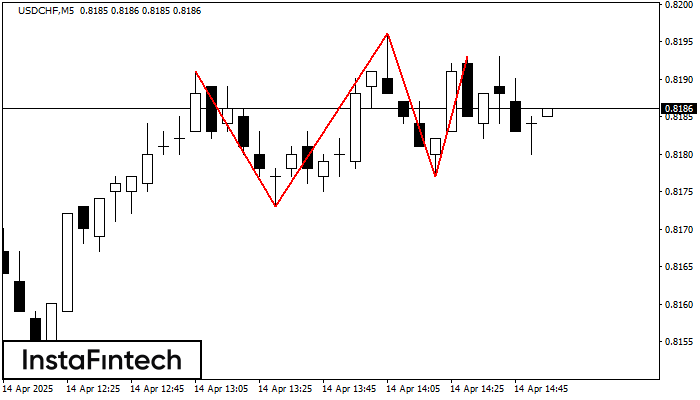
The Triple Top pattern has formed on the chart of the USDCHF M5 trading instrument. It is a reversal pattern featuring the following characteristics: resistance level -2, support level -4, and pattern’s width 18. Forecast If the price breaks through the support level 0.8173, it is likely to move further down to 0.8181.
The M5 and M15 time frames may have more false entry points.
Veja também
- All
- All
- Bearish Rectangle
- Bearish Symmetrical Triangle
- Bearish Symmetrical Triangle
- Bullish Rectangle
- Double Top
- Double Top
- Triple Bottom
- Triple Bottom
- Triple Top
- Triple Top
- All
- All
- Buy
- Sale
- All
- 1
- 2
- 3
- 4
- 5
Triângulo Simétrico de Baixa
was formed on 21.05 at 13:26:16 (UTC+0)
signal strength 1 of 5
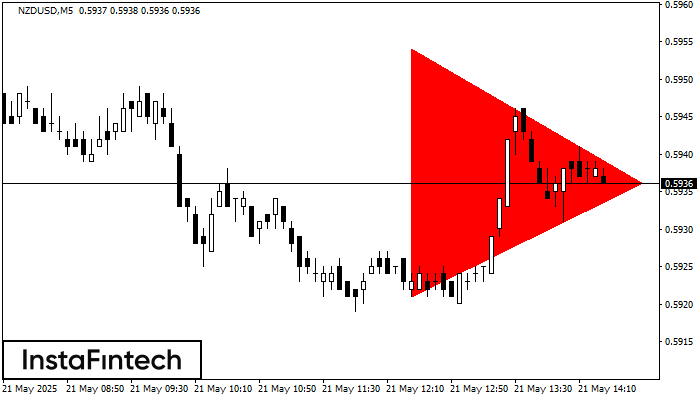
De acordo com o gráfico de M5, NZDUSD fomrou o padrão de Triângulo Simétrico de Baixa. Este padrão sinaliza uma nova tendência de baixa se o limite inferior 0.5921
Os intervalos M5 e M15 podem ter mais pontos de entrada falsos.
Open chart in a new window
Triângulo Simétrico de Alta
was formed on 21.05 at 13:01:22 (UTC+0)
signal strength 1 of 5
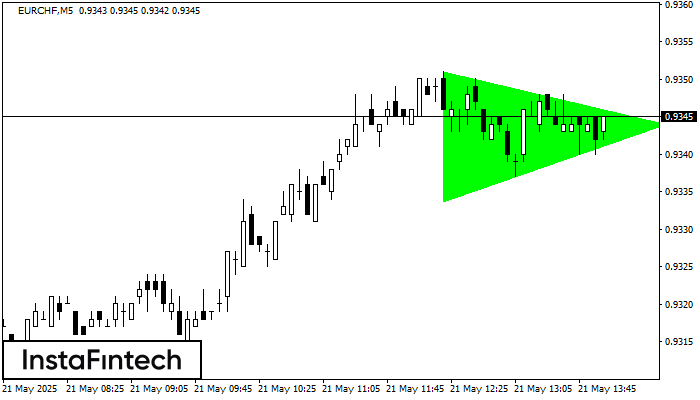
De acordo com o gráfico de M5, EURCHF formou o padrão de Triângulo Simétrico de Alta. O limite inferior do padrão toca as coordenadas 0.9334/0.9344 enquanto o limite superior cruza
Os intervalos M5 e M15 podem ter mais pontos de entrada falsos.
Open chart in a new window
Triângulo Simétrico de Baixa
was formed on 21.05 at 11:46:23 (UTC+0)
signal strength 3 of 5
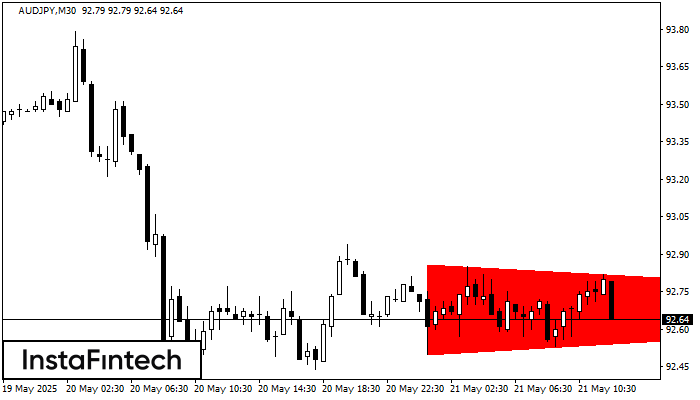
De acordo com o gráfico de M30, AUDJPY fomrou o padrão de Triângulo Simétrico de Baixa. Este padrão sinaliza uma nova tendência de baixa se o limite inferior 92.50
Open chart in a new window


