

Padrões atuais

Padrões são modelos gráficos que são formados no gráfico pelo preço. Segundo um dos postulados da análise técnica, a história (movimento de preços) se repete. Isso significa que os movimentos de preços geralmente são semelhantes nas mesmas situações, o que possibilita prever o desenvolvimento futuro da situação com alta probabilidade.
Os padrões relevantes da InstaTrade são um serviço fácil de usar, que permite que você esteja ciente das últimas mudanças no mercado e reaja a indícios do mercado a tempo. Em nosso serviço, você sempre encontrará os padrões mais recentes e relevantes em qualquer par e em qualquer período gráfico.
Bullish Symmetrical Triangle
was formed on 14.04 at 09:54:41 (UTC+0)
signal strength 4 of 5
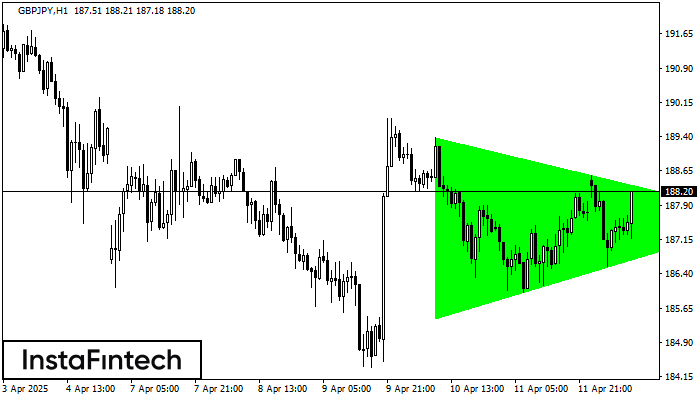
According to the chart of H1, GBPJPY formed the Bullish Symmetrical Triangle pattern. Description: This is the pattern of a trend continuation. 189.39 and 185.42 are the coordinates of the upper and lower borders respectively. The pattern width is measured on the chart at 397 pips. Outlook: If the upper border 189.39 is broken, the price is likely to continue its move by 188.01.
Veja também
- All
- All
- Bearish Rectangle
- Bearish Symmetrical Triangle
- Bearish Symmetrical Triangle
- Bullish Rectangle
- Double Top
- Double Top
- Triple Bottom
- Triple Bottom
- Triple Top
- Triple Top
- All
- All
- Buy
- Sale
- All
- 1
- 2
- 3
- 4
- 5
Retângulo de alta
was formed on 02.06 at 13:16:37 (UTC+0)
signal strength 1 of 5
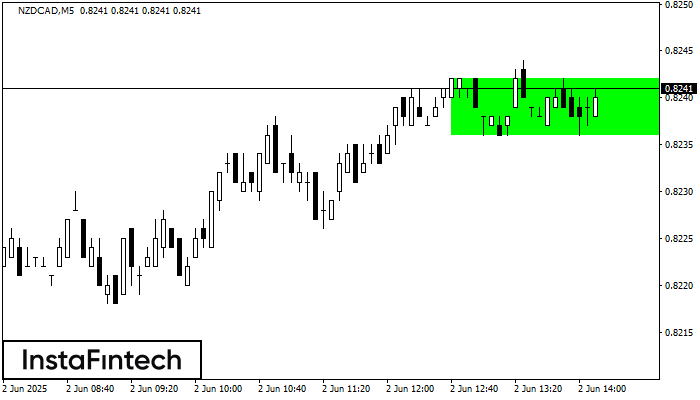
De acordo com o gráfico de M5, NZDCAD formou Retângulo de alta. O padrão indica uma continuação da tendência. O limite superior é 0.8242, o limite inferior é 0.8236
Os intervalos M5 e M15 podem ter mais pontos de entrada falsos.
Open chart in a new window
Retângulo de alta
was formed on 02.06 at 13:12:18 (UTC+0)
signal strength 1 of 5
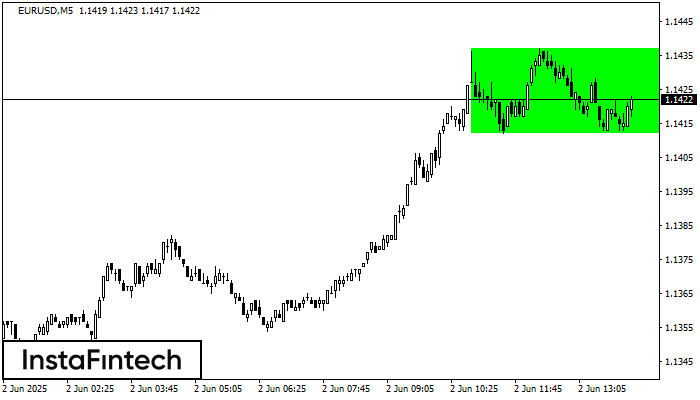
Conforme o gráfico de M5, EURUSD formou o Retângulo de alta. Este tipo de padrão indica uma continuação da tendência. Ele consiste em dois níveis: resistência 1.1437 e suporte 1.1412
Os intervalos M5 e M15 podem ter mais pontos de entrada falsos.
Open chart in a new window
Topo duplo
was formed on 02.06 at 13:05:05 (UTC+0)
signal strength 1 of 5
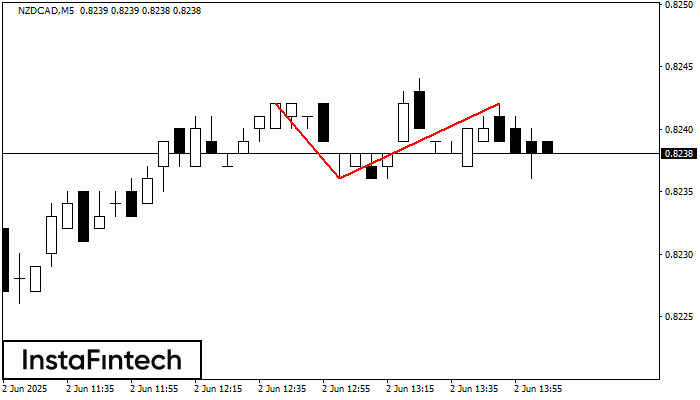
O padrão de reversão Topo duplo foi formado em NZDCAD M5. Características: o limite superior 0.8242; o limite inferior 0.8236; a largura do padrão é de 6 pontos. As operações
Os intervalos M5 e M15 podem ter mais pontos de entrada falsos.
Open chart in a new window


