

Padrões atuais

Padrões são modelos gráficos que são formados no gráfico pelo preço. Segundo um dos postulados da análise técnica, a história (movimento de preços) se repete. Isso significa que os movimentos de preços geralmente são semelhantes nas mesmas situações, o que possibilita prever o desenvolvimento futuro da situação com alta probabilidade.
Os padrões relevantes da InstaTrade são um serviço fácil de usar, que permite que você esteja ciente das últimas mudanças no mercado e reaja a indícios do mercado a tempo. Em nosso serviço, você sempre encontrará os padrões mais recentes e relevantes em qualquer par e em qualquer período gráfico.
Bullish Flag
was formed on 14.04 at 00:04:23 (UTC+0)
signal strength 2 of 5

The Bullish Flag pattern has been formed on the chart AUDJPY M15 which signals that the upward trend will continue. Signals: а break of the peak at 90.88 may push the price higher, and the rise will be the projection of the pole.
The M5 and M15 time frames may have more false entry points.
Veja também
- All
- All
- Bearish Rectangle
- Bearish Symmetrical Triangle
- Bearish Symmetrical Triangle
- Bullish Rectangle
- Double Top
- Double Top
- Triple Bottom
- Triple Bottom
- Triple Top
- Triple Top
- All
- All
- Buy
- Sale
- All
- 1
- 2
- 3
- 4
- 5
Triângulo Simétrico de Baixa
was formed on 04.06 at 04:16:58 (UTC+0)
signal strength 2 of 5
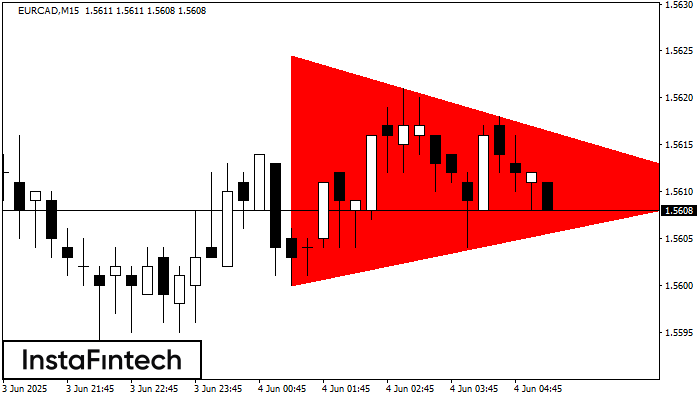
De acordo com o gráfico de M15, EURCAD fomrou o padrão de Triângulo Simétrico de Baixa. Este padrão sinaliza uma nova tendência de baixa se o limite inferior 1.5600
Os intervalos M5 e M15 podem ter mais pontos de entrada falsos.
Open chart in a new window
Topo duplo
was formed on 04.06 at 04:00:27 (UTC+0)
signal strength 3 of 5
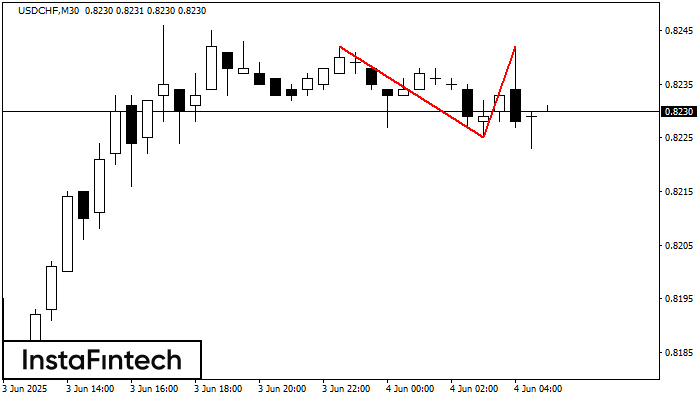
O padrão de reversão Topo duplo foi formado em USDCHF M30. Características: o limite superior 0.8242; o limite inferior 0.8225; a largura do padrão é de 17 pontos. As operações
Open chart in a new window
Topo triplo
was formed on 04.06 at 04:00:18 (UTC+0)
signal strength 3 of 5
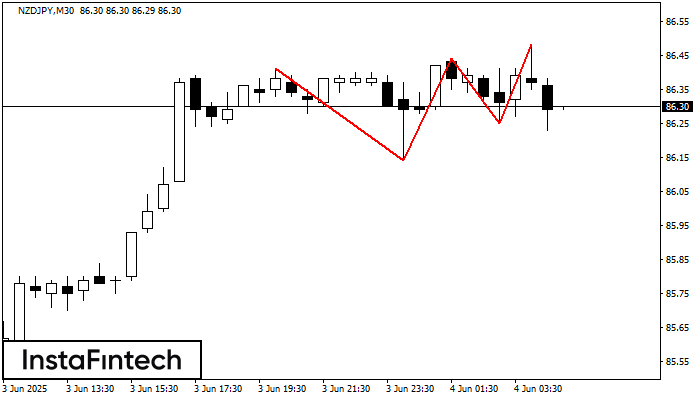
O padrão Topo triplo foi formado no gráfico do instrumento de negociação NZDJPY M30. É um padrão de reversão com as seguintes características: nível de resistência -7, nível de suporte
Open chart in a new window


