

Padrões atuais

Padrões são modelos gráficos que são formados no gráfico pelo preço. Segundo um dos postulados da análise técnica, a história (movimento de preços) se repete. Isso significa que os movimentos de preços geralmente são semelhantes nas mesmas situações, o que possibilita prever o desenvolvimento futuro da situação com alta probabilidade.
Os padrões relevantes da InstaTrade são um serviço fácil de usar, que permite que você esteja ciente das últimas mudanças no mercado e reaja a indícios do mercado a tempo. Em nosso serviço, você sempre encontrará os padrões mais recentes e relevantes em qualquer par e em qualquer período gráfico.
Inverse Head and Shoulder
was formed on 11.04 at 08:30:14 (UTC+0)
signal strength 3 of 5
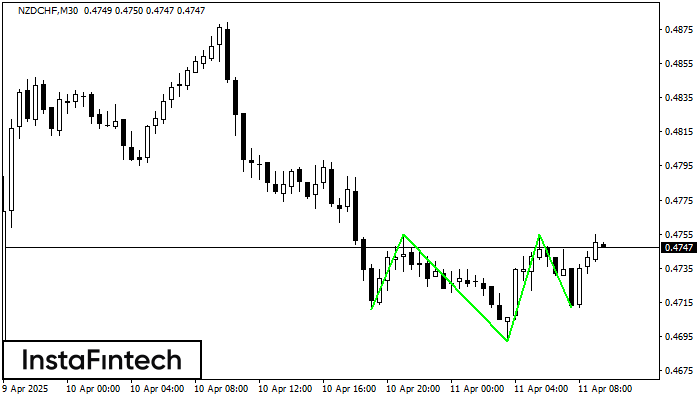
According to M30, NZDCHF is shaping the technical pattern – the Inverse Head and Shoulder. In case the Neckline 0.4755/0.4755 is broken out, the instrument is likely to move toward 0.4785.
- All
- All
- Bearish Rectangle
- Bearish Symmetrical Triangle
- Bearish Symmetrical Triangle
- Bullish Rectangle
- Double Top
- Double Top
- Triple Bottom
- Triple Bottom
- Triple Top
- Triple Top
- All
- All
- Buy
- Sale
- All
- 1
- 2
- 3
- 4
- 5
Bearish Rectangle
was formed on 28.05 at 15:05:49 (UTC+0)
signal strength 1 of 5
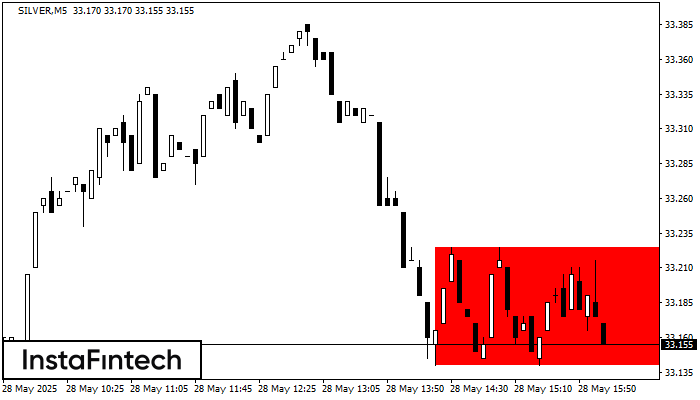
According to the chart of M5, SILVER formed the Bearish Rectangle. The pattern indicates a trend continuation. The upper border is 33.23, the lower border is 33.14. The signal means
The M5 and M15 time frames may have more false entry points.
Open chart in a new window
Bullish Symmetrical Triangle
was formed on 28.05 at 14:59:02 (UTC+0)
signal strength 2 of 5
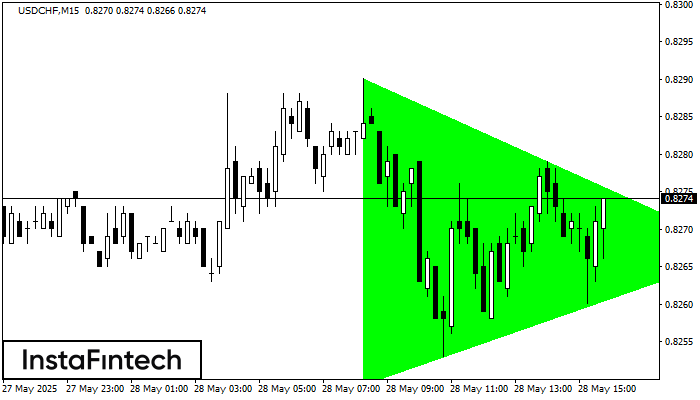
According to the chart of M15, USDCHF formed the Bullish Symmetrical Triangle pattern, which signals the trend will continue. Description. The upper border of the pattern touches the coordinates 0.8290/0.8267
The M5 and M15 time frames may have more false entry points.
Open chart in a new window
Double Bottom
was formed on 28.05 at 14:36:46 (UTC+0)
signal strength 1 of 5
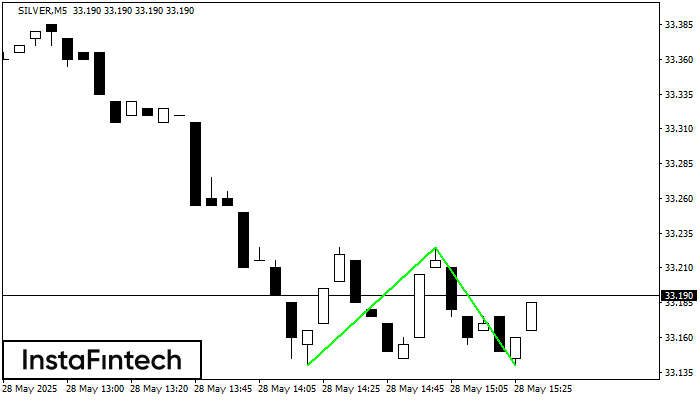
The Double Bottom pattern has been formed on SILVER M5. Characteristics: the support level 33.14; the resistance level 33.23; the width of the pattern 85 points. If the resistance level
The M5 and M15 time frames may have more false entry points.
Open chart in a new window


