

Padrões atuais

Padrões são modelos gráficos que são formados no gráfico pelo preço. Segundo um dos postulados da análise técnica, a história (movimento de preços) se repete. Isso significa que os movimentos de preços geralmente são semelhantes nas mesmas situações, o que possibilita prever o desenvolvimento futuro da situação com alta probabilidade.
Os padrões relevantes da InstaTrade são um serviço fácil de usar, que permite que você esteja ciente das últimas mudanças no mercado e reaja a indícios do mercado a tempo. Em nosso serviço, você sempre encontrará os padrões mais recentes e relevantes em qualquer par e em qualquer período gráfico.
Double Bottom
was formed on 08.04 at 00:30:13 (UTC+0)
signal strength 3 of 5
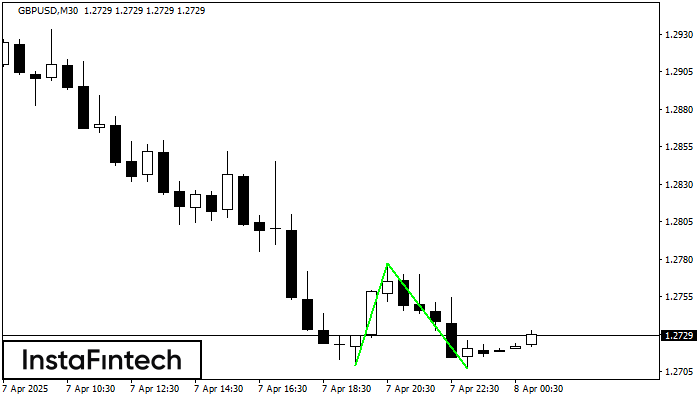
The Double Bottom pattern has been formed on GBPUSD M30. This formation signals a reversal of the trend from downwards to upwards. The signal is that a buy trade should be opened after the upper boundary of the pattern 1.2777 is broken. The further movements will rely on the width of the current pattern 68 points.
- All
- All
- Bearish Rectangle
- Bearish Symmetrical Triangle
- Bearish Symmetrical Triangle
- Bullish Rectangle
- Double Top
- Double Top
- Triple Bottom
- Triple Bottom
- Triple Top
- Triple Top
- All
- All
- Buy
- Sale
- All
- 1
- 2
- 3
- 4
- 5
Topo duplo
was formed on 04.06 at 03:30:07 (UTC+0)
signal strength 3 of 5
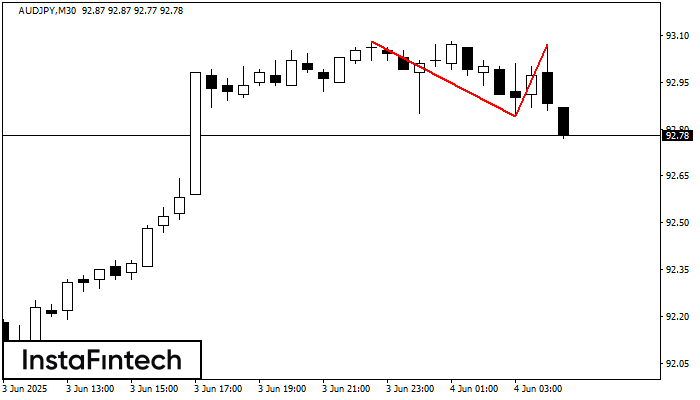
No gráfico de AUDJPY M30 o padrão de reversão Topo duplo foi formado. Características: o limite superior 93.07; o limite inferior 92.84; a largura do padrão 23 pontos. O sinal
Open chart in a new window
Retângulo de baixa
was formed on 04.06 at 03:10:59 (UTC+0)
signal strength 2 of 5
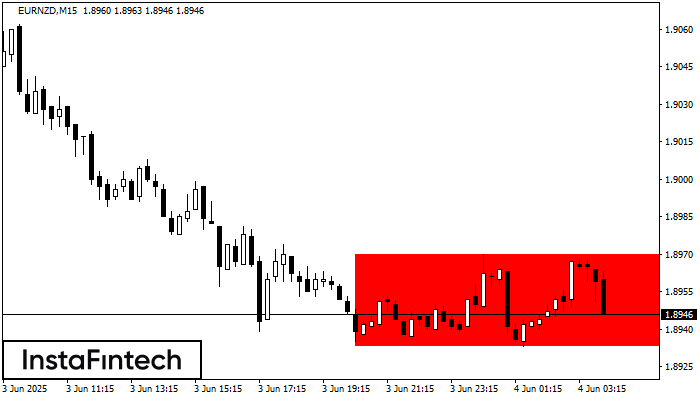
De acordo com o gráfico de M15, EURNZD formou Retângulo de baixa que é um padrão de uma continuação de tendência. O padrão está dentro dos seguintes limites: limite inferior
Os intervalos M5 e M15 podem ter mais pontos de entrada falsos.
Open chart in a new window
Triângulo Simétrico de Baixa
was formed on 04.06 at 03:00:36 (UTC+0)
signal strength 3 of 5
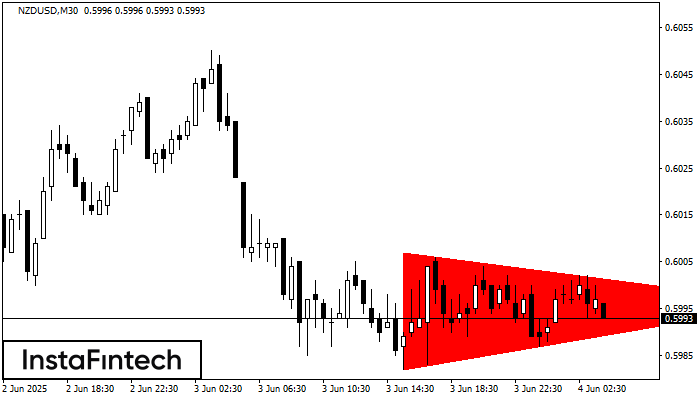
De acordo com o gráfico de M30, NZDUSD formou o padrão Triângulo Simétrico de Baixa. Descrição: o limite inferior é 0.5982/0.5996 e o limite superior é 0.6007/0.5996. A largura
Open chart in a new window


