

Padrões atuais

Padrões são modelos gráficos que são formados no gráfico pelo preço. Segundo um dos postulados da análise técnica, a história (movimento de preços) se repete. Isso significa que os movimentos de preços geralmente são semelhantes nas mesmas situações, o que possibilita prever o desenvolvimento futuro da situação com alta probabilidade.
Os padrões relevantes da InstaTrade são um serviço fácil de usar, que permite que você esteja ciente das últimas mudanças no mercado e reaja a indícios do mercado a tempo. Em nosso serviço, você sempre encontrará os padrões mais recentes e relevantes em qualquer par e em qualquer período gráfico.
Bearish pennant
was formed on 07.04 at 16:10:00 (UTC+0)
signal strength 1 of 5
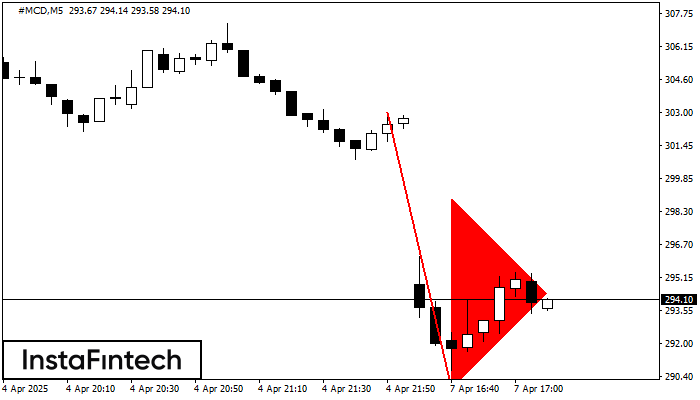
The Bearish pennant pattern has formed on the #MCD M5 chart. This pattern type is characterized by a slight slowdown after which the price will move in the direction of the original trend. In case the price fixes below the pattern’s low of 289.83, a trader will be able to successfully enter the sell position.
The M5 and M15 time frames may have more false entry points.
- All
- All
- Bearish Rectangle
- Bearish Symmetrical Triangle
- Bearish Symmetrical Triangle
- Bullish Rectangle
- Double Top
- Double Top
- Triple Bottom
- Triple Bottom
- Triple Top
- Triple Top
- All
- All
- Buy
- Sale
- All
- 1
- 2
- 3
- 4
- 5
Bullish pennant
сформирован 15.05 в 11:08:07 (UTC+0)
сила сигнала 1 из 5
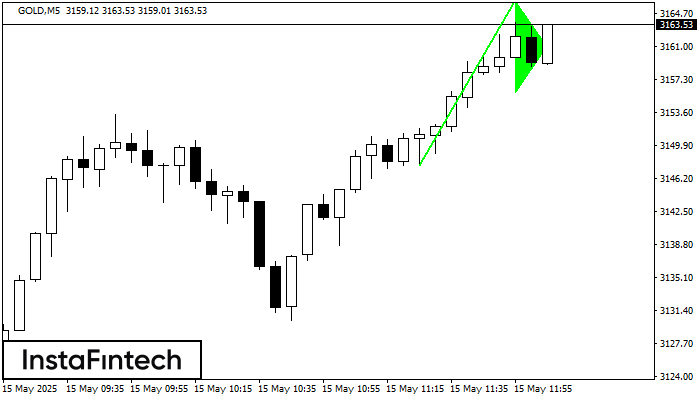
The Bullish pennant signal – Trading instrument GOLD M5, continuation pattern. Forecast: it is possible to set up a buy position above the pattern’s high of 3166.18, with the prospect
The M5 and M15 time frames may have more false entry points.
Открыть график инструмента в новом окне
Double Bottom
сформирован 15.05 в 08:59:51 (UTC+0)
сила сигнала 3 из 5
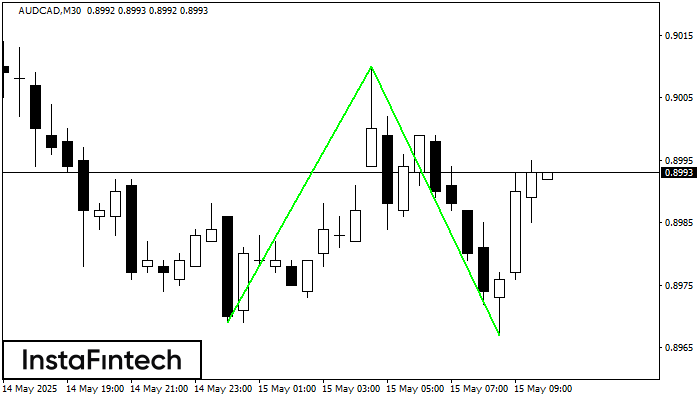
The Double Bottom pattern has been formed on AUDCAD M30. Characteristics: the support level 0.8969; the resistance level 0.9010; the width of the pattern 41 points. If the resistance level
Открыть график инструмента в новом окне
Double Bottom
сформирован 15.05 в 08:30:09 (UTC+0)
сила сигнала 3 из 5
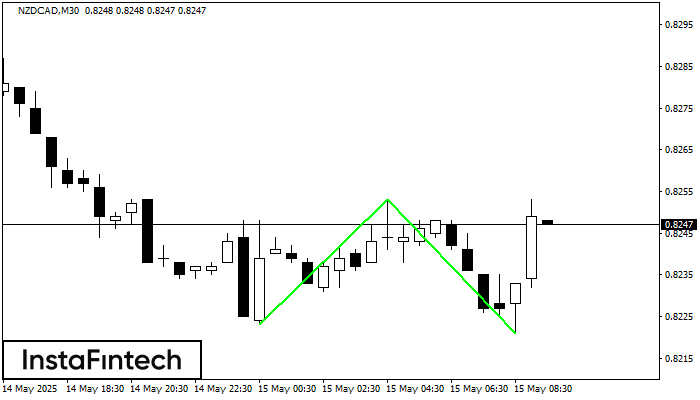
The Double Bottom pattern has been formed on NZDCAD M30. Characteristics: the support level 0.8223; the resistance level 0.8253; the width of the pattern 30 points. If the resistance level
Открыть график инструмента в новом окне


