

Padrões atuais

Padrões são modelos gráficos que são formados no gráfico pelo preço. Segundo um dos postulados da análise técnica, a história (movimento de preços) se repete. Isso significa que os movimentos de preços geralmente são semelhantes nas mesmas situações, o que possibilita prever o desenvolvimento futuro da situação com alta probabilidade.
Os padrões relevantes da InstaTrade são um serviço fácil de usar, que permite que você esteja ciente das últimas mudanças no mercado e reaja a indícios do mercado a tempo. Em nosso serviço, você sempre encontrará os padrões mais recentes e relevantes em qualquer par e em qualquer período gráfico.
Bullish Rectangle
was formed on 07.04 at 13:58:52 (UTC+0)
signal strength 1 of 5
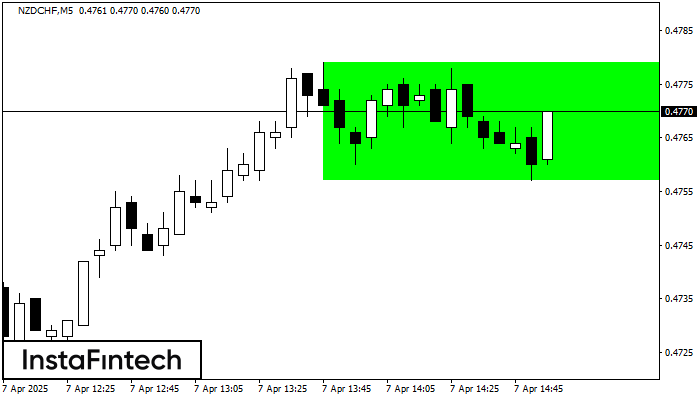
According to the chart of M5, NZDCHF formed the Bullish Rectangle which is a pattern of a trend continuation. The pattern is contained within the following borders: the lower border 0.4757 – 0.4757 and upper border 0.4779 – 0.4779. In case the upper border is broken, the instrument is likely to follow the upward trend.
The M5 and M15 time frames may have more false entry points.
Veja também
- All
- All
- Bearish Rectangle
- Bearish Symmetrical Triangle
- Bearish Symmetrical Triangle
- Bullish Rectangle
- Double Top
- Double Top
- Triple Bottom
- Triple Bottom
- Triple Top
- Triple Top
- All
- All
- Buy
- Sale
- All
- 1
- 2
- 3
- 4
- 5
Topo triplo
was formed on 28.05 at 03:01:28 (UTC+0)
signal strength 3 of 5
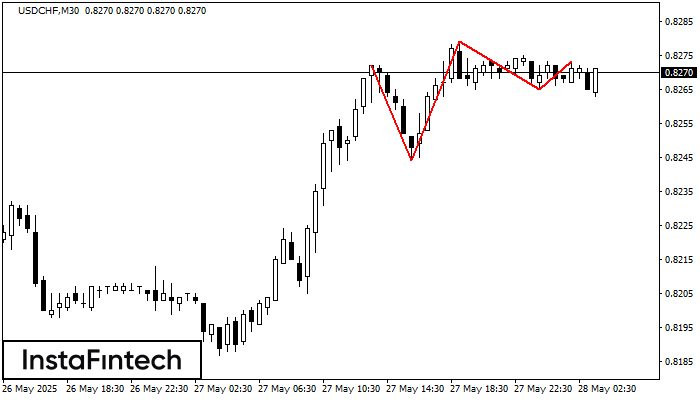
O padrão Topo triplo foi formado no gráfico do instrumento de negociação USDCHF M30. É um padrão de reversão com as seguintes características: nível de resistência -1, nível de suporte
Open chart in a new window
Fundo triplo
was formed on 28.05 at 03:00:31 (UTC+0)
signal strength 2 of 5
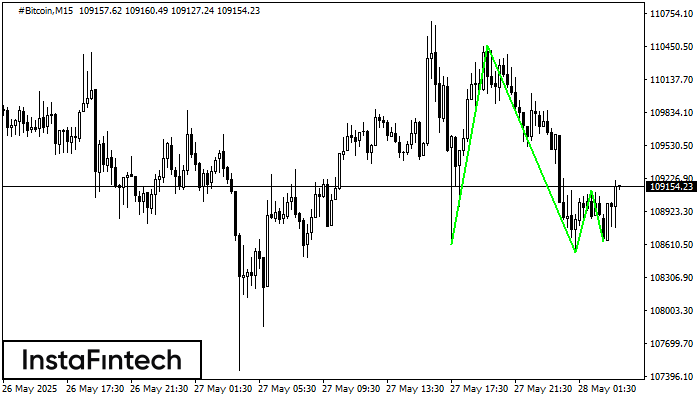
O padrão Fundo triplo foi formado no gráfico de #Bitcoin M15. Características do padrão: A linha inferior do padrão tem coordenadas 110459.83 com o limite superior 110459.83/109114.84, a projeção
Os intervalos M5 e M15 podem ter mais pontos de entrada falsos.
Open chart in a new window
Topo triplo
was formed on 28.05 at 02:41:05 (UTC+0)
signal strength 1 of 5
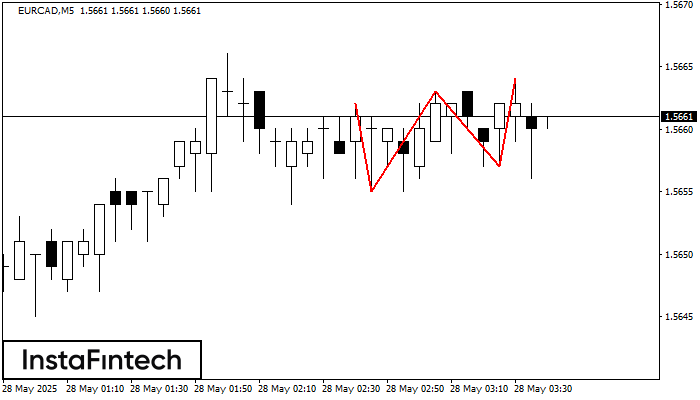
No gráfico do instrumento de negociação EURCAD M5, o padrão Topo triplo que sinaliza uma mudança de tendência se formou. É possível que após a formação do terceiro pico
Os intervalos M5 e M15 podem ter mais pontos de entrada falsos.
Open chart in a new window


