

Padrões atuais

Padrões são modelos gráficos que são formados no gráfico pelo preço. Segundo um dos postulados da análise técnica, a história (movimento de preços) se repete. Isso significa que os movimentos de preços geralmente são semelhantes nas mesmas situações, o que possibilita prever o desenvolvimento futuro da situação com alta probabilidade.
Os padrões relevantes da InstaTrade são um serviço fácil de usar, que permite que você esteja ciente das últimas mudanças no mercado e reaja a indícios do mercado a tempo. Em nosso serviço, você sempre encontrará os padrões mais recentes e relevantes em qualquer par e em qualquer período gráfico.
Double Bottom
was formed on 07.04 at 10:29:41 (UTC+0)
signal strength 3 of 5
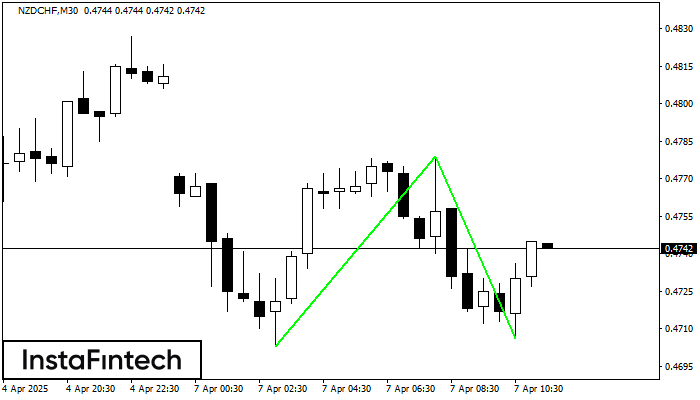
The Double Bottom pattern has been formed on NZDCHF M30. This formation signals a reversal of the trend from downwards to upwards. The signal is that a buy trade should be opened after the upper boundary of the pattern 0.4779 is broken. The further movements will rely on the width of the current pattern 76 points.
- All
- All
- Bearish Rectangle
- Bearish Symmetrical Triangle
- Bearish Symmetrical Triangle
- Bullish Rectangle
- Double Top
- Double Top
- Triple Bottom
- Triple Bottom
- Triple Top
- Triple Top
- All
- All
- Buy
- Sale
- All
- 1
- 2
- 3
- 4
- 5
Cabeça & Ombro Invertidos
was formed on 21.05 at 10:40:34 (UTC+0)
signal strength 1 of 5
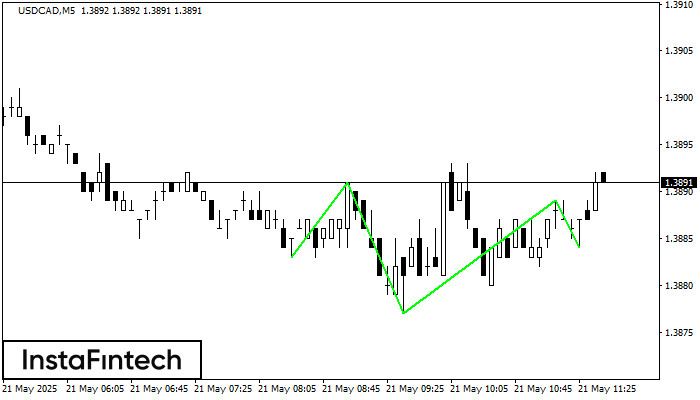
De acordo com o gráfico de M5, USDCAD formou o padrão Cabeça & Ombro Invertidos. O topo da Cabeça é definido em 1.3889 enquanto a linha mediana do Pescoço
Os intervalos M5 e M15 podem ter mais pontos de entrada falsos.
Open chart in a new window
Fundo triplo
was formed on 21.05 at 10:00:16 (UTC+0)
signal strength 4 of 5
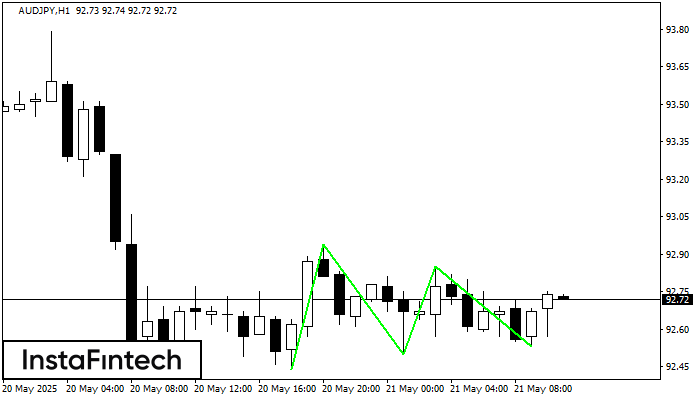
O padrão Fundo triplo foi formado em AUDJPY H1. Possui as seguintes características: nível de resistência 92.94/92.85; nível de suporte 92.44/92.53; a largura é de 50 pontos. Se houver
Open chart in a new window
Fundo duplo
was formed on 21.05 at 10:00:05 (UTC+0)
signal strength 3 of 5
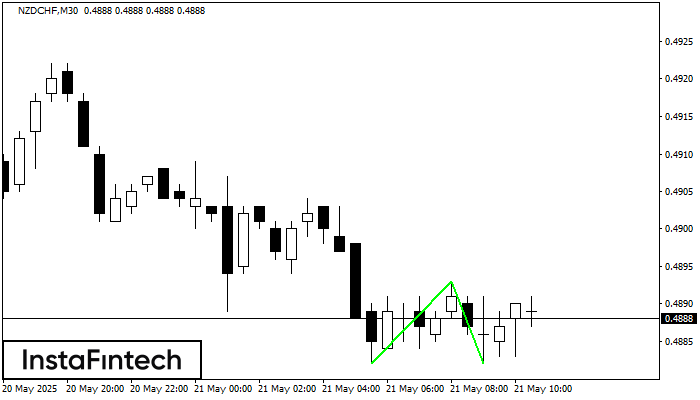
O padrão Fundo duplo foi formado em NZDCHF M30. Características: o nível de suporte 0.4882; o nível de resistência 0.4893; a largura do padrão 11 pontos. Se o nível
Open chart in a new window


