

Padrões atuais

Padrões são modelos gráficos que são formados no gráfico pelo preço. Segundo um dos postulados da análise técnica, a história (movimento de preços) se repete. Isso significa que os movimentos de preços geralmente são semelhantes nas mesmas situações, o que possibilita prever o desenvolvimento futuro da situação com alta probabilidade.
Os padrões relevantes da InstaTrade são um serviço fácil de usar, que permite que você esteja ciente das últimas mudanças no mercado e reaja a indícios do mercado a tempo. Em nosso serviço, você sempre encontrará os padrões mais recentes e relevantes em qualquer par e em qualquer período gráfico.
Double Bottom
was formed on 07.04 at 08:55:04 (UTC+0)
signal strength 1 of 5
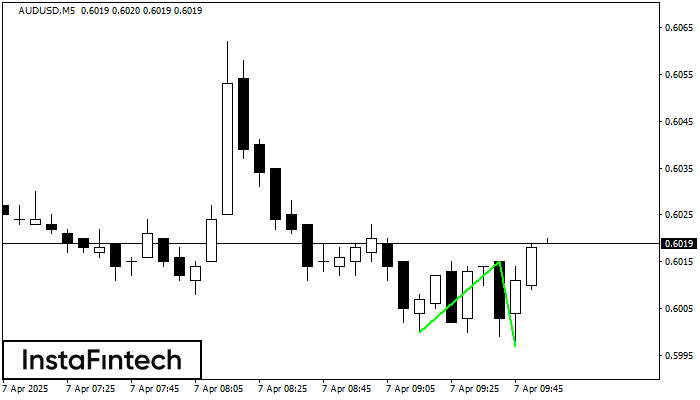
The Double Bottom pattern has been formed on AUDUSD M5; the upper boundary is 0.6015; the lower boundary is 0.5997. The width of the pattern is 15 points. In case of a break of the upper boundary 0.6015, a change in the trend can be predicted where the width of the pattern will coincide with the distance to a possible take profit level.
The M5 and M15 time frames may have more false entry points.
Veja também
- All
- All
- Bearish Rectangle
- Bearish Symmetrical Triangle
- Bearish Symmetrical Triangle
- Bullish Rectangle
- Double Top
- Double Top
- Triple Bottom
- Triple Bottom
- Triple Top
- Triple Top
- All
- All
- Buy
- Sale
- All
- 1
- 2
- 3
- 4
- 5
Topo duplo
was formed on 19.05 at 19:45:15 (UTC+0)
signal strength 1 of 5
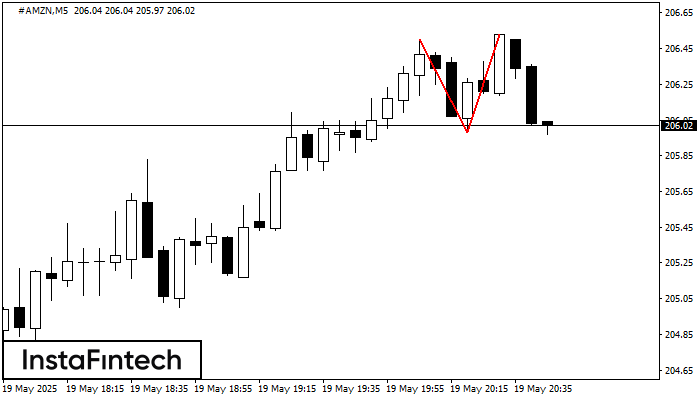
No gráfico de #AMZN M5 o padrão de reversão Topo duplo foi formado. Características: o limite superior 206.53; o limite inferior 205.98; a largura do padrão 55 pontos. O sinal
Os intervalos M5 e M15 podem ter mais pontos de entrada falsos.
Open chart in a new window
Fundo triplo
was formed on 19.05 at 19:30:18 (UTC+0)
signal strength 1 of 5
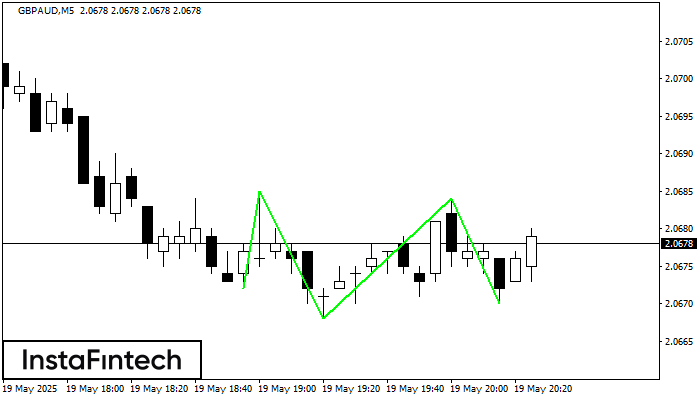
O padrão Fundo triplo foi formado em GBPAUD M5. Possui as seguintes características: nível de resistência 2.0685/2.0684; nível de suporte 2.0672/2.0670; a largura é de 13 pontos. Se houver
Os intervalos M5 e M15 podem ter mais pontos de entrada falsos.
Open chart in a new window
Fundo duplo
was formed on 19.05 at 19:20:16 (UTC+0)
signal strength 1 of 5
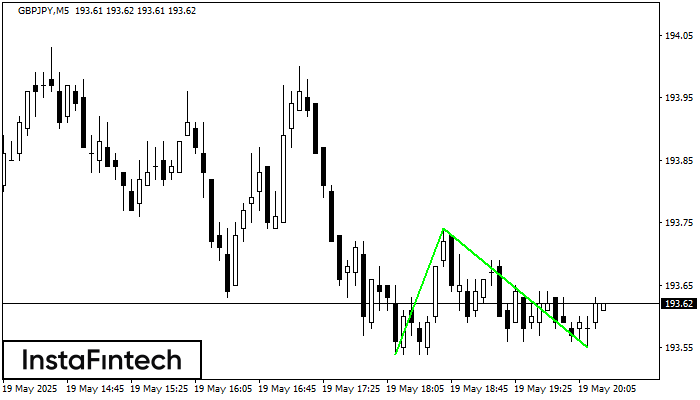
O padrão Fundo duplo foi formado em GBPJPY M5. Esta formação sinaliza uma reversão da tendência de baixo para cima. O sinal é que uma negociação de compra deve
Os intervalos M5 e M15 podem ter mais pontos de entrada falsos.
Open chart in a new window


