

Padrões atuais

Padrões são modelos gráficos que são formados no gráfico pelo preço. Segundo um dos postulados da análise técnica, a história (movimento de preços) se repete. Isso significa que os movimentos de preços geralmente são semelhantes nas mesmas situações, o que possibilita prever o desenvolvimento futuro da situação com alta probabilidade.
Os padrões relevantes da InstaTrade são um serviço fácil de usar, que permite que você esteja ciente das últimas mudanças no mercado e reaja a indícios do mercado a tempo. Em nosso serviço, você sempre encontrará os padrões mais recentes e relevantes em qualquer par e em qualquer período gráfico.
Triple Top
was formed on 07.04 at 05:36:16 (UTC+0)
signal strength 1 of 5
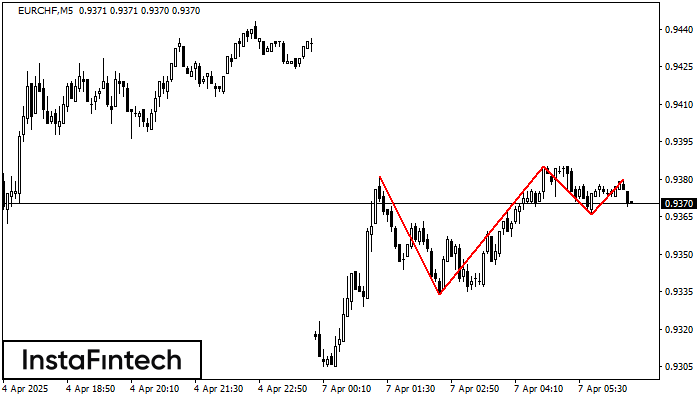
The Triple Top pattern has formed on the chart of the EURCHF M5. Features of the pattern: borders have an ascending angle; the lower line of the pattern has the coordinates 0.9334/0.9366 with the upper limit 0.9381/0.9380; the projection of the width is 47 points. The formation of the Triple Top figure most likely indicates a change in the trend from upward to downward. This means that in the event of a breakdown of the support level of 0.9334, the price is most likely to continue the downward movement.
The M5 and M15 time frames may have more false entry points.
- All
- All
- Bearish Rectangle
- Bearish Symmetrical Triangle
- Bearish Symmetrical Triangle
- Bullish Rectangle
- Double Top
- Double Top
- Triple Bottom
- Triple Bottom
- Triple Top
- Triple Top
- All
- All
- Buy
- Sale
- All
- 1
- 2
- 3
- 4
- 5
Bearish Rectangle
was formed on 14.05 at 15:00:57 (UTC+0)
signal strength 1 of 5
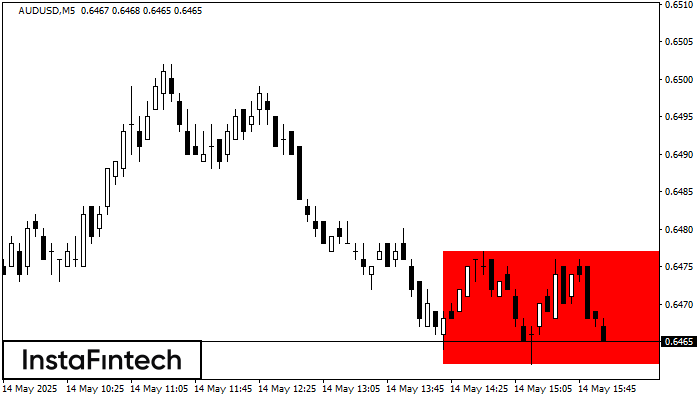
According to the chart of M5, AUDUSD formed the Bearish Rectangle. The pattern indicates a trend continuation. The upper border is 0.6477, the lower border is 0.6462. The signal means
The M5 and M15 time frames may have more false entry points.
Open chart in a new window
Bullish Rectangle
was formed on 14.05 at 14:43:51 (UTC+0)
signal strength 1 of 5
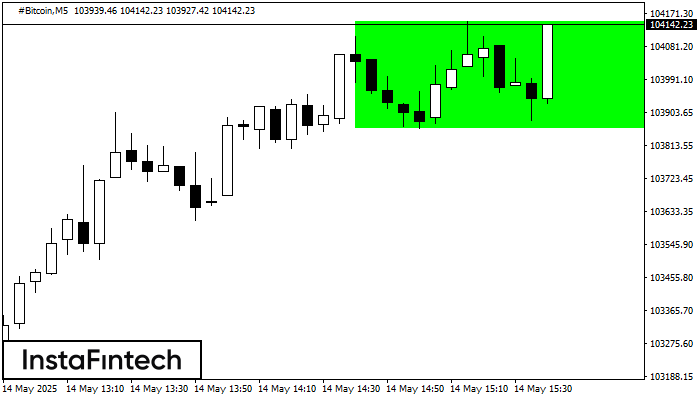
According to the chart of M5, #Bitcoin formed the Bullish Rectangle. This type of a pattern indicates a trend continuation. It consists of two levels: resistance 104149.50 and support 103860.12
The M5 and M15 time frames may have more false entry points.
Open chart in a new window
Double Top
was formed on 14.05 at 14:15:17 (UTC+0)
signal strength 2 of 5
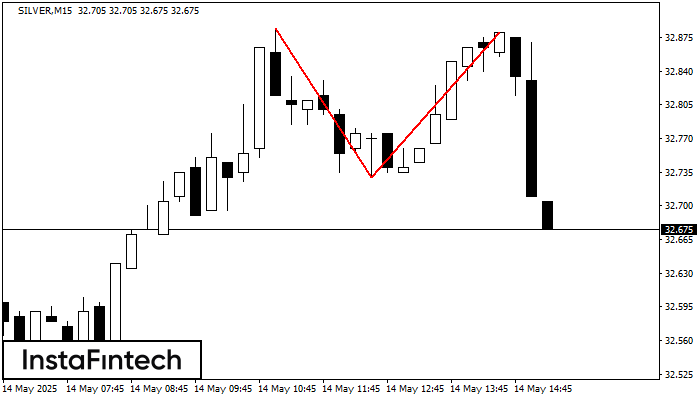
On the chart of SILVER M15 the Double Top reversal pattern has been formed. Characteristics: the upper boundary 32.88; the lower boundary 32.73; the width of the pattern 150 points
The M5 and M15 time frames may have more false entry points.
Open chart in a new window


