

Padrões atuais

Padrões são modelos gráficos que são formados no gráfico pelo preço. Segundo um dos postulados da análise técnica, a história (movimento de preços) se repete. Isso significa que os movimentos de preços geralmente são semelhantes nas mesmas situações, o que possibilita prever o desenvolvimento futuro da situação com alta probabilidade.
Os padrões relevantes da InstaTrade são um serviço fácil de usar, que permite que você esteja ciente das últimas mudanças no mercado e reaja a indícios do mercado a tempo. Em nosso serviço, você sempre encontrará os padrões mais recentes e relevantes em qualquer par e em qualquer período gráfico.
Double Top
was formed on 07.04 at 05:05:04 (UTC+0)
signal strength 1 of 5
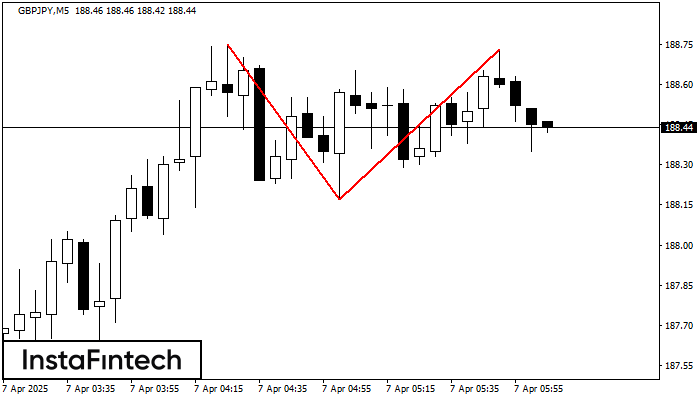
The Double Top reversal pattern has been formed on GBPJPY M5. Characteristics: the upper boundary 188.75; the lower boundary 188.17; the width of the pattern is 56 points. Sell trades are better to be opened below the lower boundary 188.17 with a possible movements towards the 188.02 level.
The M5 and M15 time frames may have more false entry points.
Veja também
- All
- All
- Bearish Rectangle
- Bearish Symmetrical Triangle
- Bearish Symmetrical Triangle
- Bullish Rectangle
- Double Top
- Double Top
- Triple Bottom
- Triple Bottom
- Triple Top
- Triple Top
- All
- All
- Buy
- Sale
- All
- 1
- 2
- 3
- 4
- 5
Bullish pennant
was formed on 24.04 at 16:23:38 (UTC+0)
signal strength 1 of 5
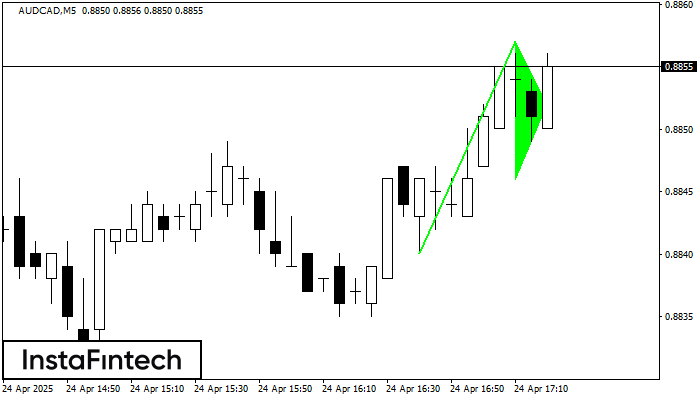
The Bullish pennant signal – Trading instrument AUDCAD M5, continuation pattern. Forecast: it is possible to set up a buy position above the pattern’s high of 0.8857, with the prospect
The M5 and M15 time frames may have more false entry points.
Open chart in a new window
Bullish Symmetrical Triangle
was formed on 24.04 at 16:02:25 (UTC+0)
signal strength 1 of 5
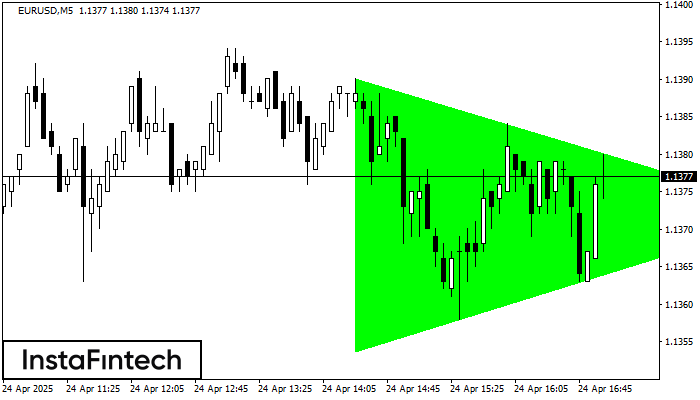
According to the chart of M5, EURUSD formed the Bullish Symmetrical Triangle pattern. Description: This is the pattern of a trend continuation. 1.1390 and 1.1354 are the coordinates
The M5 and M15 time frames may have more false entry points.
Open chart in a new window
Bullish Rectangle
was formed on 24.04 at 16:01:14 (UTC+0)
signal strength 2 of 5
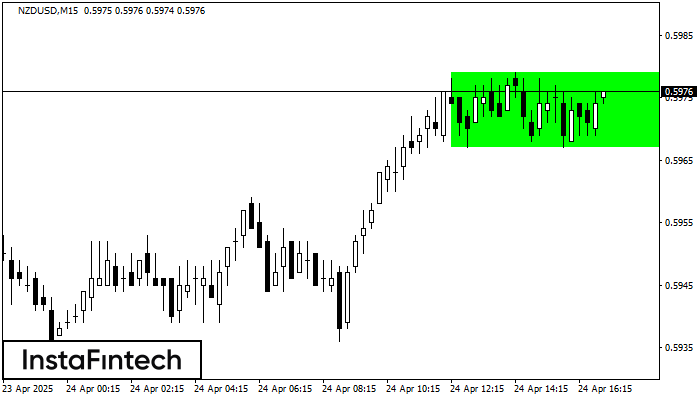
According to the chart of M15, NZDUSD formed the Bullish Rectangle. The pattern indicates a trend continuation. The upper border is 0.5979, the lower border is 0.5967. The signal means
The M5 and M15 time frames may have more false entry points.
Open chart in a new window


