

Padrões atuais

Padrões são modelos gráficos que são formados no gráfico pelo preço. Segundo um dos postulados da análise técnica, a história (movimento de preços) se repete. Isso significa que os movimentos de preços geralmente são semelhantes nas mesmas situações, o que possibilita prever o desenvolvimento futuro da situação com alta probabilidade.
Os padrões relevantes da InstaTrade são um serviço fácil de usar, que permite que você esteja ciente das últimas mudanças no mercado e reaja a indícios do mercado a tempo. Em nosso serviço, você sempre encontrará os padrões mais recentes e relevantes em qualquer par e em qualquer período gráfico.
Bearish pennant
was formed on 07.04 at 01:00:16 (UTC+0)
signal strength 3 of 5

The Bearish pennant pattern has formed on the NZDUSD M30 chart. It signals potential continuation of the existing trend. Specifications: the pattern’s bottom has the coordinate of 0.5563; the projection of the flagpole height is equal to 29 pips. In case the price breaks out the pattern’s bottom of 0.5563, the downtrend is expected to continue for further level 0.5533.
- All
- All
- Bearish Rectangle
- Bearish Symmetrical Triangle
- Bearish Symmetrical Triangle
- Bullish Rectangle
- Double Top
- Double Top
- Triple Bottom
- Triple Bottom
- Triple Top
- Triple Top
- All
- All
- Buy
- Sale
- All
- 1
- 2
- 3
- 4
- 5
Triple Top
was formed on 19.05 at 14:10:27 (UTC+0)
signal strength 1 of 5
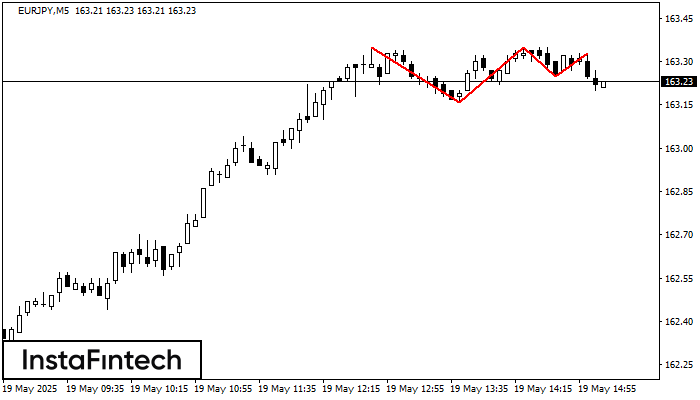
The Triple Top pattern has formed on the chart of the EURJPY M5 trading instrument. It is a reversal pattern featuring the following characteristics: resistance level 2, support level -9
The M5 and M15 time frames may have more false entry points.
Open chart in a new window
Double Top
was formed on 19.05 at 14:00:06 (UTC+0)
signal strength 1 of 5
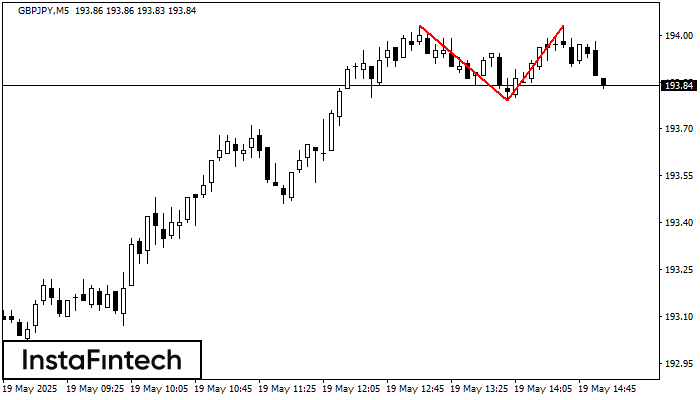
On the chart of GBPJPY M5 the Double Top reversal pattern has been formed. Characteristics: the upper boundary 194.03; the lower boundary 193.79; the width of the pattern 24 points
The M5 and M15 time frames may have more false entry points.
Open chart in a new window
Double Top
was formed on 19.05 at 13:59:52 (UTC+0)
signal strength 4 of 5
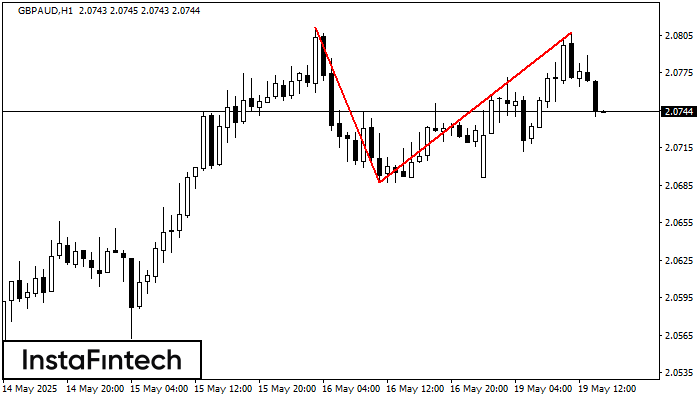
The Double Top reversal pattern has been formed on GBPAUD H1. Characteristics: the upper boundary 2.0811; the lower boundary 2.0687; the width of the pattern is 120 points. Sell trades
Open chart in a new window


