

Padrões atuais

Padrões são modelos gráficos que são formados no gráfico pelo preço. Segundo um dos postulados da análise técnica, a história (movimento de preços) se repete. Isso significa que os movimentos de preços geralmente são semelhantes nas mesmas situações, o que possibilita prever o desenvolvimento futuro da situação com alta probabilidade.
Os padrões relevantes da InstaTrade são um serviço fácil de usar, que permite que você esteja ciente das últimas mudanças no mercado e reaja a indícios do mercado a tempo. Em nosso serviço, você sempre encontrará os padrões mais recentes e relevantes em qualquer par e em qualquer período gráfico.
Bearish Symmetrical Triangle
was formed on 04.04 at 20:15:50 (UTC+0)
signal strength 1 of 5
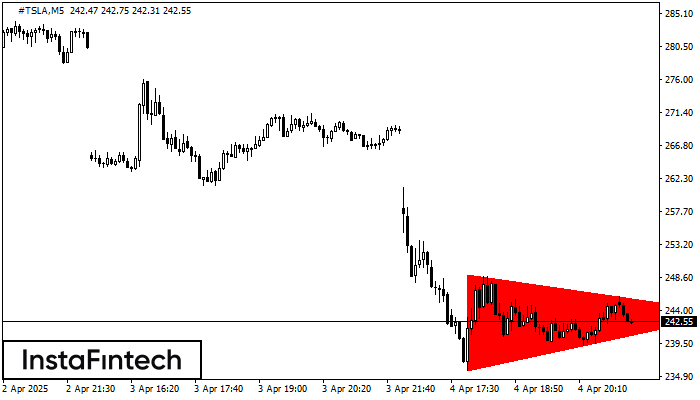
According to the chart of M5, #TSLA formed the Bearish Symmetrical Triangle pattern. Description: The lower border is 235.81/243.68 and upper border is 249.04/243.68. The pattern width is measured on the chart at -1323 pips. The formation of the Bearish Symmetrical Triangle pattern evidently signals a continuation of the downward trend. In other words, if the scenario comes true and #TSLA breaches the lower border, the price could continue its move toward 243.53.
The M5 and M15 time frames may have more false entry points.
Veja também
- All
- All
- Bearish Rectangle
- Bearish Symmetrical Triangle
- Bearish Symmetrical Triangle
- Bullish Rectangle
- Double Top
- Double Top
- Triple Bottom
- Triple Bottom
- Triple Top
- Triple Top
- All
- All
- Buy
- Sale
- All
- 1
- 2
- 3
- 4
- 5
Fundo duplo
was formed on 22.05 at 12:25:21 (UTC+0)
signal strength 1 of 5
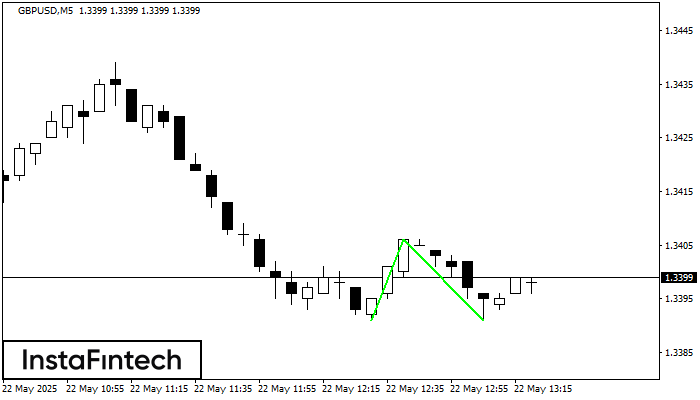
O padrão Fundo duplo foi formado em GBPUSD M5. Características: o nível de suporte 1.3391; o nível de resistência 1.3406; a largura do padrão 15 pontos. Se o nível
Os intervalos M5 e M15 podem ter mais pontos de entrada falsos.
Open chart in a new window
Triângulo Simétrico de Baixa
was formed on 22.05 at 11:37:12 (UTC+0)
signal strength 1 of 5
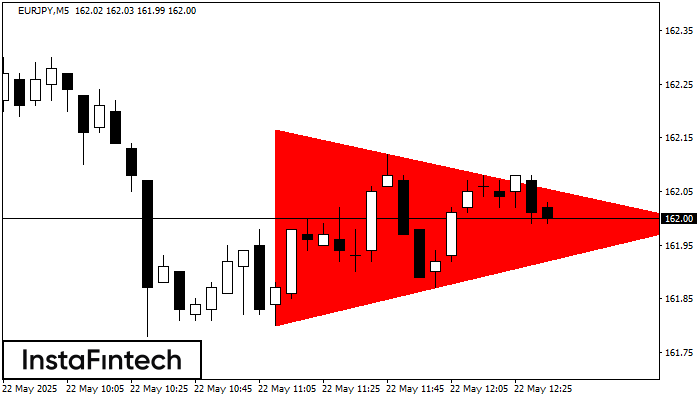
De acordo com o gráfico de M5, EURJPY formou o padrão Triângulo Simétrico de Baixa. Descrição: o limite inferior é 161.80/161.99 e o limite superior é 162.17/161.99. A largura
Os intervalos M5 e M15 podem ter mais pontos de entrada falsos.
Open chart in a new window
Fundo duplo
was formed on 22.05 at 10:30:10 (UTC+0)
signal strength 3 of 5
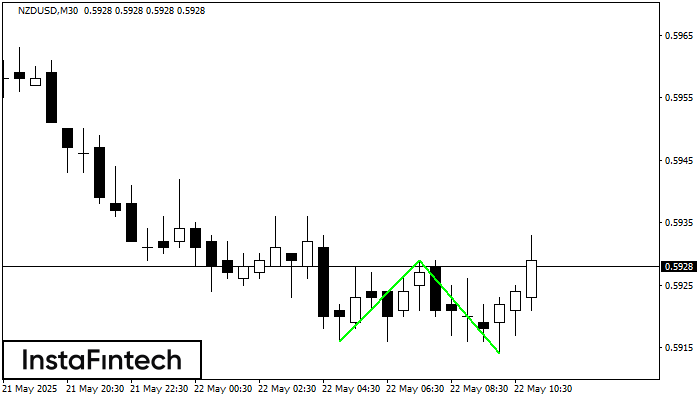
O padrão Fundo duplo foi formado em NZDUSD M30. Características: o nível de suporte 0.5916; o nível de resistência 0.5929; a largura do padrão 13 pontos. Se o nível
Open chart in a new window


