

Padrões atuais

Padrões são modelos gráficos que são formados no gráfico pelo preço. Segundo um dos postulados da análise técnica, a história (movimento de preços) se repete. Isso significa que os movimentos de preços geralmente são semelhantes nas mesmas situações, o que possibilita prever o desenvolvimento futuro da situação com alta probabilidade.
Os padrões relevantes da InstaTrade são um serviço fácil de usar, que permite que você esteja ciente das últimas mudanças no mercado e reaja a indícios do mercado a tempo. Em nosso serviço, você sempre encontrará os padrões mais recentes e relevantes em qualquer par e em qualquer período gráfico.
Double Bottom
was formed on 04.04 at 19:45:18 (UTC+0)
signal strength 1 of 5
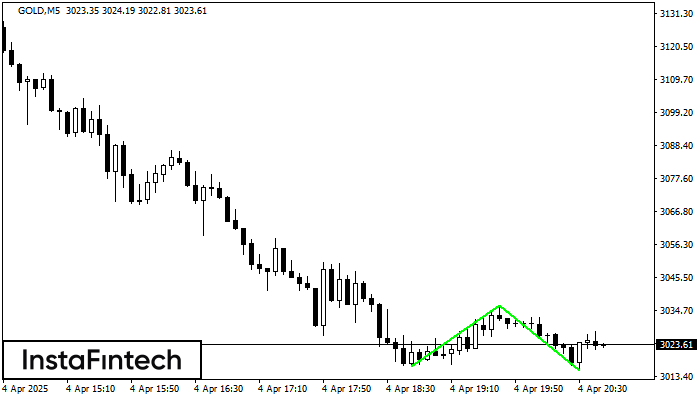
The Double Bottom pattern has been formed on GOLD M5. This formation signals a reversal of the trend from downwards to upwards. The signal is that a buy trade should be opened after the upper boundary of the pattern 3036.35 is broken. The further movements will rely on the width of the current pattern 1989 points.
The M5 and M15 time frames may have more false entry points.
- All
- All
- Bearish Rectangle
- Bearish Symmetrical Triangle
- Bearish Symmetrical Triangle
- Bullish Rectangle
- Double Top
- Double Top
- Triple Bottom
- Triple Bottom
- Triple Top
- Triple Top
- All
- All
- Buy
- Sale
- All
- 1
- 2
- 3
- 4
- 5
Bearish pennant
сформирован 28.05 в 08:12:58 (UTC+0)
сила сигнала 1 из 5

The Bearish pennant pattern has formed on the GBPJPY M5 chart. It signals potential continuation of the existing trend. Specifications: the pattern’s bottom has the coordinate of 194.35; the projection
The M5 and M15 time frames may have more false entry points.
Открыть график инструмента в новом окне
Bullish Symmetrical Triangle
сформирован 28.05 в 07:55:36 (UTC+0)
сила сигнала 1 из 5

According to the chart of M5, GBPAUD formed the Bullish Symmetrical Triangle pattern, which signals the trend will continue. Description. The upper border of the pattern touches the coordinates 2.0988/2.0939
The M5 and M15 time frames may have more false entry points.
Открыть график инструмента в новом окне
Bearish Symmetrical Triangle
сформирован 28.05 в 07:55:12 (UTC+0)
сила сигнала 1 из 5

According to the chart of M5, NZDJPY formed the Bearish Symmetrical Triangle pattern. Description: The lower border is 85.44/85.92 and upper border is 86.64/85.92. The pattern width is measured
The M5 and M15 time frames may have more false entry points.
Открыть график инструмента в новом окне


