

Padrões atuais

Padrões são modelos gráficos que são formados no gráfico pelo preço. Segundo um dos postulados da análise técnica, a história (movimento de preços) se repete. Isso significa que os movimentos de preços geralmente são semelhantes nas mesmas situações, o que possibilita prever o desenvolvimento futuro da situação com alta probabilidade.
Os padrões relevantes da InstaTrade são um serviço fácil de usar, que permite que você esteja ciente das últimas mudanças no mercado e reaja a indícios do mercado a tempo. Em nosso serviço, você sempre encontrará os padrões mais recentes e relevantes em qualquer par e em qualquer período gráfico.
Bearish Flag
was formed on 04.04 at 17:33:28 (UTC+0)
signal strength 2 of 5

The Bearish Flag pattern has been formed on the chart #TSLA M15 which signals that the downward trend will continue. If the price breaks below the low at 235.81, then it is most likely to move further downwards. The price will likely move by the number of points which equals the length of the flag pole (15 points).
The M5 and M15 time frames may have more false entry points.
Veja também
- All
- All
- Bearish Rectangle
- Bearish Symmetrical Triangle
- Bearish Symmetrical Triangle
- Bullish Rectangle
- Double Top
- Double Top
- Triple Bottom
- Triple Bottom
- Triple Top
- Triple Top
- All
- All
- Buy
- Sale
- All
- 1
- 2
- 3
- 4
- 5
Topo duplo
was formed on 03.06 at 01:35:08 (UTC+0)
signal strength 1 of 5
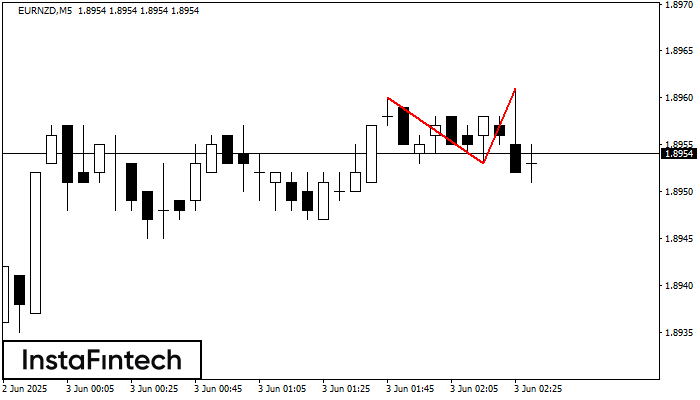
No gráfico de EURNZD M5 o padrão de reversão Topo duplo foi formado. Características: o limite superior 1.8961; o limite inferior 1.8953; a largura do padrão 8 pontos. O sinal
Os intervalos M5 e M15 podem ter mais pontos de entrada falsos.
Open chart in a new window
Topo triplo
was formed on 03.06 at 00:30:20 (UTC+0)
signal strength 3 of 5
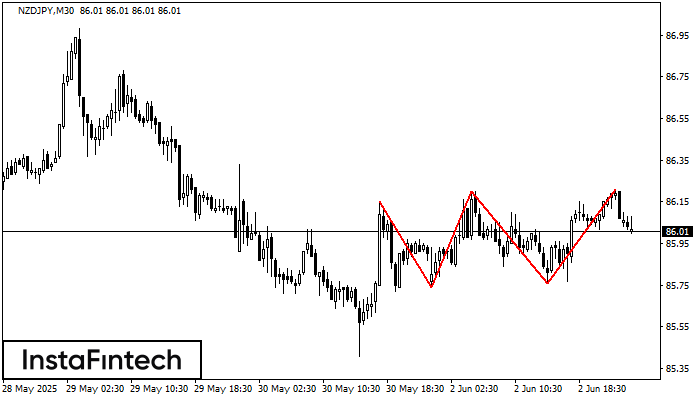
O padrão Topo triplo se formou no gráfico de NZDJPY M30. Características do padrão: os limites têm um ângulo ascendente; a linha inferior do padrão tem as coordenadas 85.74/85.76
Open chart in a new window
Fundo triplo
was formed on 03.06 at 00:05:20 (UTC+0)
signal strength 1 of 5

O padrão Fundo triplo foi formado no gráfico de USDJPY M5. Características do padrão: A linha inferior do padrão tem coordenadas 142.75 com o limite superior 142.75/142.69, a projeção
Os intervalos M5 e M15 podem ter mais pontos de entrada falsos.
Open chart in a new window


