

Padrões atuais

Padrões são modelos gráficos que são formados no gráfico pelo preço. Segundo um dos postulados da análise técnica, a história (movimento de preços) se repete. Isso significa que os movimentos de preços geralmente são semelhantes nas mesmas situações, o que possibilita prever o desenvolvimento futuro da situação com alta probabilidade.
Os padrões relevantes da InstaTrade são um serviço fácil de usar, que permite que você esteja ciente das últimas mudanças no mercado e reaja a indícios do mercado a tempo. Em nosso serviço, você sempre encontrará os padrões mais recentes e relevantes em qualquer par e em qualquer período gráfico.
Bearish Rectangle
was formed on 04.04 at 04:21:33 (UTC+0)
signal strength 2 of 5
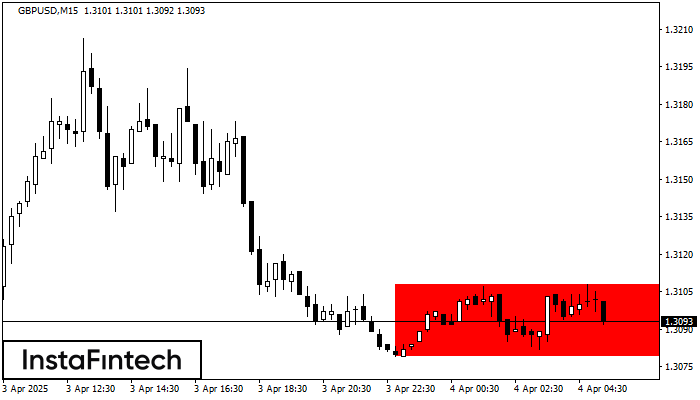
According to the chart of M15, GBPUSD formed the Bearish Rectangle. The pattern indicates a trend continuation. The upper border is 1.3108, the lower border is 1.3079. The signal means that a short position should be opened after fixing a price below the lower border 1.3079 of the Bearish Rectangle.
The M5 and M15 time frames may have more false entry points.
- All
- All
- Bearish Rectangle
- Bearish Symmetrical Triangle
- Bearish Symmetrical Triangle
- Bullish Rectangle
- Double Top
- Double Top
- Triple Bottom
- Triple Bottom
- Triple Top
- Triple Top
- All
- All
- Buy
- Sale
- All
- 1
- 2
- 3
- 4
- 5
Fundo duplo
was formed on 17.04 at 04:15:46 (UTC+0)
signal strength 2 of 5

O padrão Fundo duplo foi formado em EURCAD M15. Características: o nível de suporte 1.5761; o nível de resistência 1.5828; a largura do padrão 67 pontos. Se o nível
Os intervalos M5 e M15 podem ter mais pontos de entrada falsos.
Open chart in a new window
Retângulo de alta
was formed on 17.04 at 03:25:23 (UTC+0)
signal strength 1 of 5

Conforme o gráfico de M5, NZDCHF formou o Retângulo de alta. Este tipo de padrão indica uma continuação da tendência. Ele consiste em dois níveis: resistência 0.4833 e suporte 0.4824
Os intervalos M5 e M15 podem ter mais pontos de entrada falsos.
Open chart in a new window
Triângulo Simétrico de Alta
was formed on 17.04 at 03:06:58 (UTC+0)
signal strength 2 of 5

De acordo com o gráfico de M15, EURNZD formou o padrão de Triângulo Simétrico de Alta. O limite inferior do padrão toca as coordenadas 1.9161/1.9208 enquanto o limite superior cruza
Os intervalos M5 e M15 podem ter mais pontos de entrada falsos.
Open chart in a new window


