

Padrões atuais

Padrões são modelos gráficos que são formados no gráfico pelo preço. Segundo um dos postulados da análise técnica, a história (movimento de preços) se repete. Isso significa que os movimentos de preços geralmente são semelhantes nas mesmas situações, o que possibilita prever o desenvolvimento futuro da situação com alta probabilidade.
Os padrões relevantes da InstaTrade são um serviço fácil de usar, que permite que você esteja ciente das últimas mudanças no mercado e reaja a indícios do mercado a tempo. Em nosso serviço, você sempre encontrará os padrões mais recentes e relevantes em qualquer par e em qualquer período gráfico.
Bearish Symmetrical Triangle
was formed on 04.04 at 03:30:52 (UTC+0)
signal strength 1 of 5
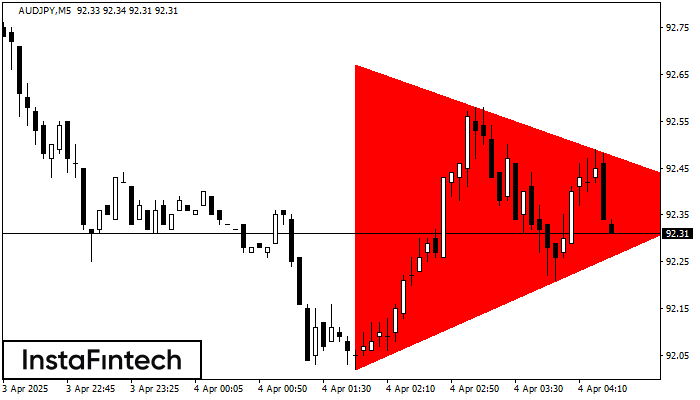
According to the chart of M5, AUDJPY formed the Bearish Symmetrical Triangle pattern. Description: The lower border is 92.02/92.38 and upper border is 92.67/92.38. The pattern width is measured on the chart at -65 pips. The formation of the Bearish Symmetrical Triangle pattern evidently signals a continuation of the downward trend. In other words, if the scenario comes true and AUDJPY breaches the lower border, the price could continue its move toward 92.23.
The M5 and M15 time frames may have more false entry points.
Veja também
- All
- All
- Bearish Rectangle
- Bearish Symmetrical Triangle
- Bearish Symmetrical Triangle
- Bullish Rectangle
- Double Top
- Double Top
- Triple Bottom
- Triple Bottom
- Triple Top
- Triple Top
- All
- All
- Buy
- Sale
- All
- 1
- 2
- 3
- 4
- 5
Retângulo de baixa
was formed on 28.04 at 03:46:06 (UTC+0)
signal strength 1 of 5
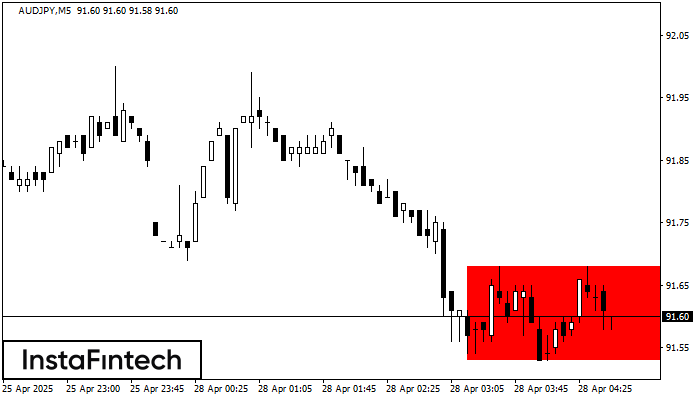
De acordo com o gráfico de M5, AUDJPY formou Retângulo de baixa. Este tipo de padrão indica uma continuação da tendência. Ele consiste em dois níveis: resistência 91.68 – 0.00
Os intervalos M5 e M15 podem ter mais pontos de entrada falsos.
Open chart in a new window
Fundo duplo
was formed on 28.04 at 03:00:33 (UTC+0)
signal strength 3 of 5
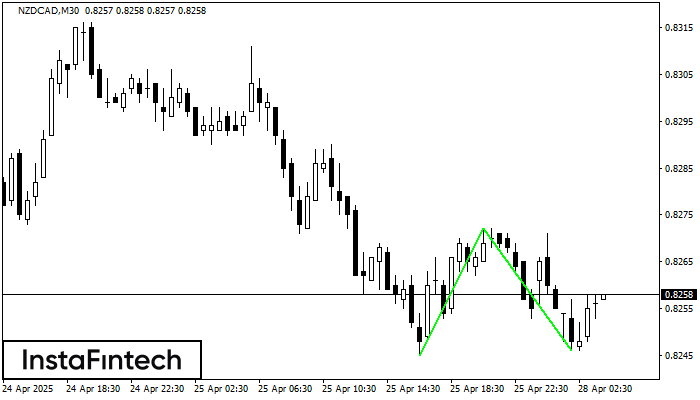
O padrão Fundo duplo foi formado em NZDCAD M30. Características: o nível de suporte 0.8245; o nível de resistência 0.8272; a largura do padrão 27 pontos. Se o nível
Open chart in a new window
Bandeira de Alta
was formed on 28.04 at 02:42:05 (UTC+0)
signal strength 1 of 5
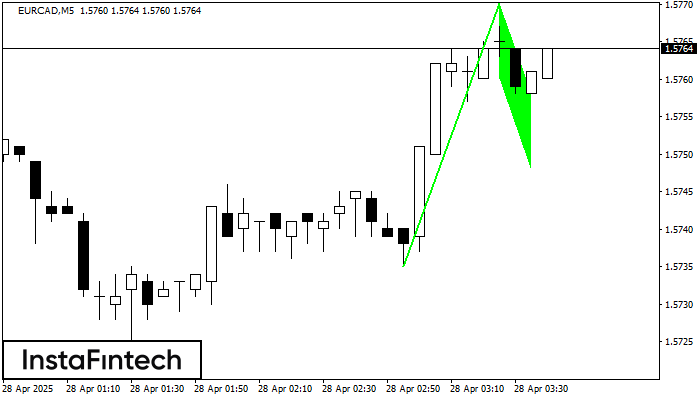
O padrão Bandeira de Alta foi formado no gráfico EURCAD M5, o que sinaliza que a tendência ascendente continuará. Sinais: uma quebra do pico em 1.5770 pode empurrar o preço
Os intervalos M5 e M15 podem ter mais pontos de entrada falsos.
Open chart in a new window


