

Padrões atuais

Padrões são modelos gráficos que são formados no gráfico pelo preço. Segundo um dos postulados da análise técnica, a história (movimento de preços) se repete. Isso significa que os movimentos de preços geralmente são semelhantes nas mesmas situações, o que possibilita prever o desenvolvimento futuro da situação com alta probabilidade.
Os padrões relevantes da InstaTrade são um serviço fácil de usar, que permite que você esteja ciente das últimas mudanças no mercado e reaja a indícios do mercado a tempo. Em nosso serviço, você sempre encontrará os padrões mais recentes e relevantes em qualquer par e em qualquer período gráfico.
Bearish pennant
was formed on 03.04 at 20:00:14 (UTC+0)
signal strength 3 of 5
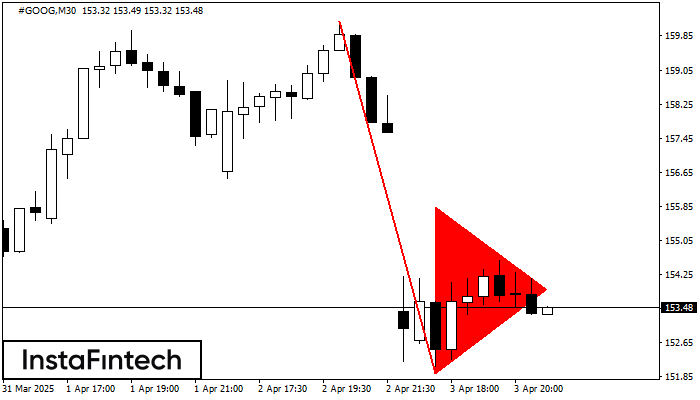
The Bearish pennant pattern has formed on the #GOOG M30 chart. It signals potential continuation of the existing trend. Specifications: the pattern’s bottom has the coordinate of 151.94; the projection of the flagpole height is equal to 824 pips. In case the price breaks out the pattern’s bottom of 151.94, the downtrend is expected to continue for further level 151.64.
- All
- All
- Bearish Rectangle
- Bearish Symmetrical Triangle
- Bearish Symmetrical Triangle
- Bullish Rectangle
- Double Top
- Double Top
- Triple Bottom
- Triple Bottom
- Triple Top
- Triple Top
- All
- All
- Buy
- Sale
- All
- 1
- 2
- 3
- 4
- 5
Pennant de baixa
was formed on 28.05 at 08:12:58 (UTC+0)
signal strength 1 of 5

O padrão Pennant de baixa foi formado no gráfico GBPJPY M5. Ele sinaliza a continuação potencial da tendência existente. Especificações: o fundo do padrão tem a coordenada de 194.35;
Os intervalos M5 e M15 podem ter mais pontos de entrada falsos.
Open chart in a new window
Triângulo Simétrico de Alta
was formed on 28.05 at 07:55:36 (UTC+0)
signal strength 1 of 5

De acordo com o gráfico de M5, GBPAUD formou o padrão de Triângulo Simétrico de Alta, sinalizando que a tendência continuará. Descrição: O limite superior do padrão toca as coordenadas
Os intervalos M5 e M15 podem ter mais pontos de entrada falsos.
Open chart in a new window
Triângulo Simétrico de Baixa
was formed on 28.05 at 07:55:12 (UTC+0)
signal strength 1 of 5

De acordo com o gráfico de M5, NZDJPY formou o padrão Triângulo Simétrico de Baixa. Descrição: o limite inferior é 85.44/85.92 e o limite superior é 86.64/85.92. A largura
Os intervalos M5 e M15 podem ter mais pontos de entrada falsos.
Open chart in a new window


