

Padrões atuais

Padrões são modelos gráficos que são formados no gráfico pelo preço. Segundo um dos postulados da análise técnica, a história (movimento de preços) se repete. Isso significa que os movimentos de preços geralmente são semelhantes nas mesmas situações, o que possibilita prever o desenvolvimento futuro da situação com alta probabilidade.
Os padrões relevantes da InstaTrade são um serviço fácil de usar, que permite que você esteja ciente das últimas mudanças no mercado e reaja a indícios do mercado a tempo. Em nosso serviço, você sempre encontrará os padrões mais recentes e relevantes em qualquer par e em qualquer período gráfico.
Double Bottom
was formed on 02.04 at 18:55:21 (UTC+0)
signal strength 1 of 5
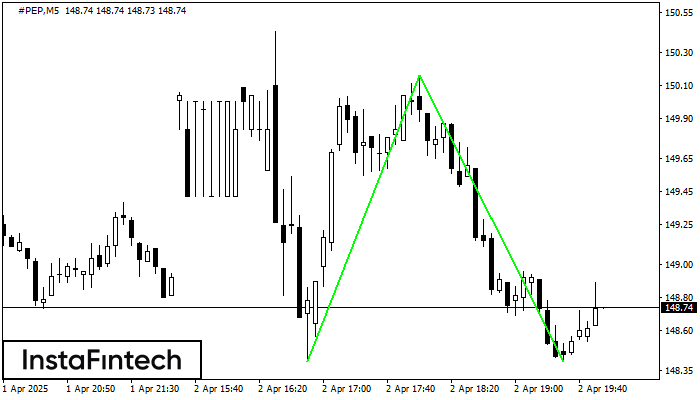
The Double Bottom pattern has been formed on #PEP M5; the upper boundary is 150.16; the lower boundary is 148.41. The width of the pattern is 175 points. In case of a break of the upper boundary 150.16, a change in the trend can be predicted where the width of the pattern will coincide with the distance to a possible take profit level.
The M5 and M15 time frames may have more false entry points.
- All
- All
- Bearish Rectangle
- Bearish Symmetrical Triangle
- Bearish Symmetrical Triangle
- Bullish Rectangle
- Double Top
- Double Top
- Triple Bottom
- Triple Bottom
- Triple Top
- Triple Top
- All
- All
- Buy
- Sale
- All
- 1
- 2
- 3
- 4
- 5
Bandeira de Alta
was formed on 12.06 at 10:30:01 (UTC+0)
signal strength 2 of 5
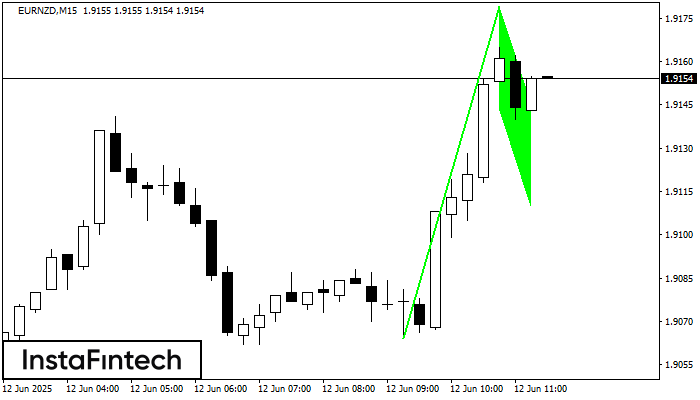
O padrão Bandeira de Alta que sinaliza a continuação de uma tendência foi formado no gráfico EURNZD M15. Previsão: se o preço ultrapassar o padrão de alta em 1.9179
Os intervalos M5 e M15 podem ter mais pontos de entrada falsos.
Open chart in a new window
Pennant de alta
was formed on 12.06 at 10:29:55 (UTC+0)
signal strength 2 of 5
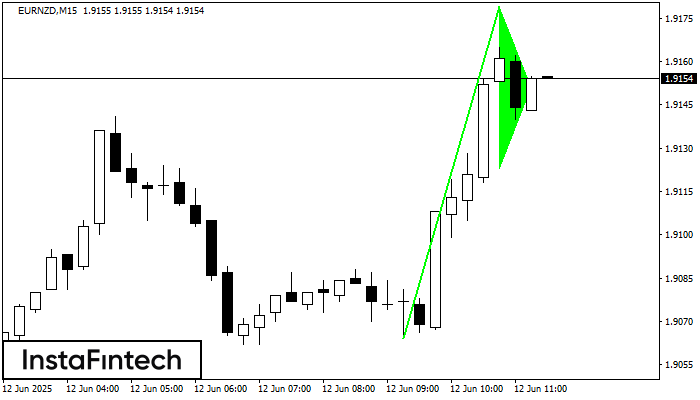
O padrão gráfico Pennant de alta foi formado no instrumento EURNZD M15. Esse tipo de padrão se enquadra na categoria de padrões de continuação. Neste caso, se a cotação conseguir
Os intervalos M5 e M15 podem ter mais pontos de entrada falsos.
Open chart in a new window
Retângulo de alta
was formed on 12.06 at 10:02:16 (UTC+0)
signal strength 2 of 5
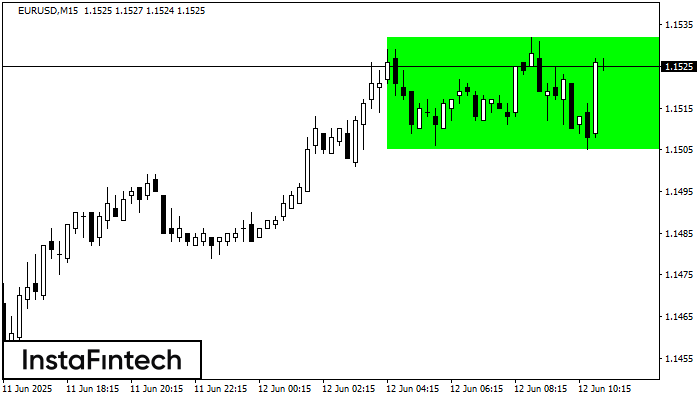
De acordo com o gráfico de M15, EURUSD formou Retângulo de alta. O padrão indica uma continuação da tendência. O limite superior é 1.1532, o limite inferior é 1.1505
Os intervalos M5 e M15 podem ter mais pontos de entrada falsos.
Open chart in a new window


