

Padrões atuais

Padrões são modelos gráficos que são formados no gráfico pelo preço. Segundo um dos postulados da análise técnica, a história (movimento de preços) se repete. Isso significa que os movimentos de preços geralmente são semelhantes nas mesmas situações, o que possibilita prever o desenvolvimento futuro da situação com alta probabilidade.
Os padrões relevantes da InstaTrade são um serviço fácil de usar, que permite que você esteja ciente das últimas mudanças no mercado e reaja a indícios do mercado a tempo. Em nosso serviço, você sempre encontrará os padrões mais recentes e relevantes em qualquer par e em qualquer período gráfico.
Double Bottom
was formed on 02.04 at 14:31:55 (UTC+0)
signal strength 2 of 5
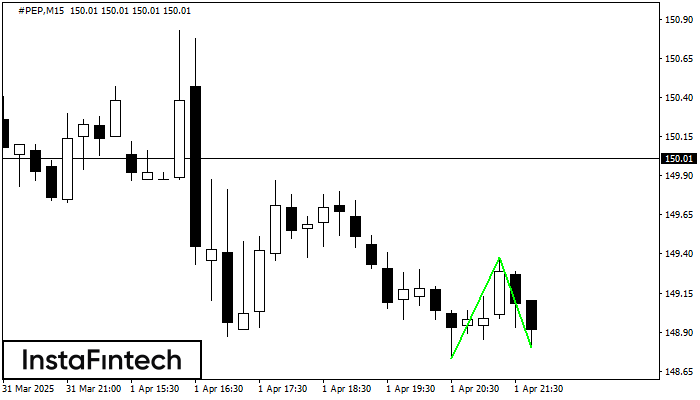
The Double Bottom pattern has been formed on #PEP M15; the upper boundary is 149.38; the lower boundary is 148.80. The width of the pattern is 65 points. In case of a break of the upper boundary 149.38, a change in the trend can be predicted where the width of the pattern will coincide with the distance to a possible take profit level.
The M5 and M15 time frames may have more false entry points.
- All
- All
- Bearish Rectangle
- Bearish Symmetrical Triangle
- Bearish Symmetrical Triangle
- Bullish Rectangle
- Double Top
- Double Top
- Triple Bottom
- Triple Bottom
- Triple Top
- Triple Top
- All
- All
- Buy
- Sale
- All
- 1
- 2
- 3
- 4
- 5
Pennant de alta
was formed on 04.06 at 16:45:12 (UTC+0)
signal strength 2 of 5
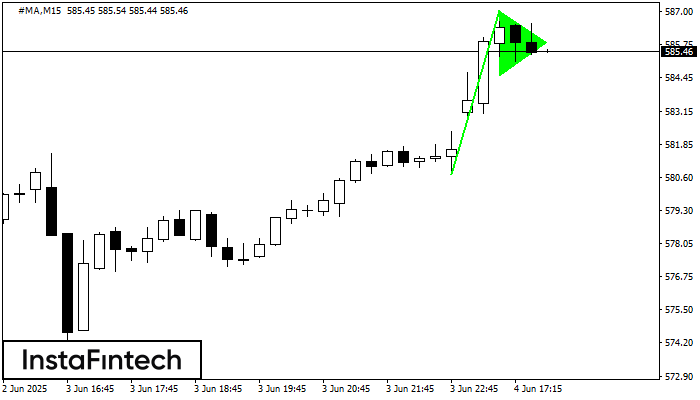
O sinal de Pennant de alta – Instrumento de negociação #MA M15, padrão de continuação. Previsão: é possível definir uma posição de compra acima da altura do padrão de 587.06
Os intervalos M5 e M15 podem ter mais pontos de entrada falsos.
Open chart in a new window
Topo duplo
was formed on 04.06 at 16:44:51 (UTC+0)
signal strength 2 of 5
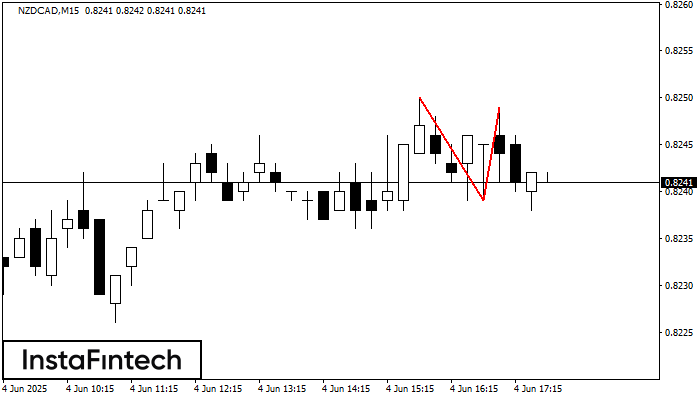
O padrão Topo duplo foi formado em NZDCAD M15. Isso sinaliza que a tendência foi alterada de cima para baixo. Provavelmente, se a base do padrão 0.8239 for quebrada
Os intervalos M5 e M15 podem ter mais pontos de entrada falsos.
Open chart in a new window
Pennant de alta
was formed on 04.06 at 16:12:47 (UTC+0)
signal strength 1 of 5
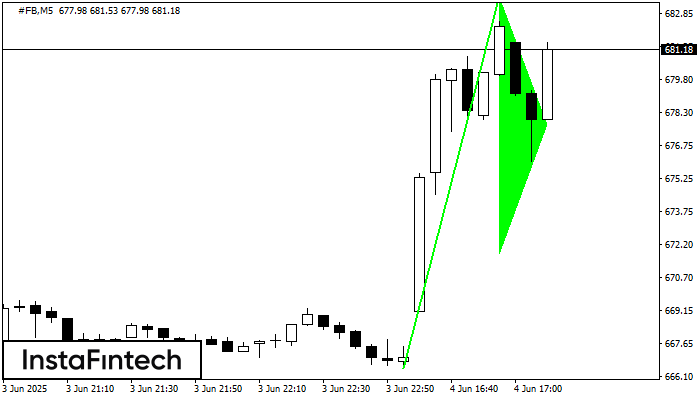
O padrão Pennant de alta é formado no gráfico #FB M5. Ele é um tipo do padrão de continuação. Supostamente, se o preço for fixado acima da alta de 683.66
Os intervalos M5 e M15 podem ter mais pontos de entrada falsos.
Open chart in a new window


