

Padrões atuais

Padrões são modelos gráficos que são formados no gráfico pelo preço. Segundo um dos postulados da análise técnica, a história (movimento de preços) se repete. Isso significa que os movimentos de preços geralmente são semelhantes nas mesmas situações, o que possibilita prever o desenvolvimento futuro da situação com alta probabilidade.
Os padrões relevantes da InstaTrade são um serviço fácil de usar, que permite que você esteja ciente das últimas mudanças no mercado e reaja a indícios do mercado a tempo. Em nosso serviço, você sempre encontrará os padrões mais recentes e relevantes em qualquer par e em qualquer período gráfico.
Triple Top
was formed on 02.04 at 06:50:26 (UTC+0)
signal strength 1 of 5
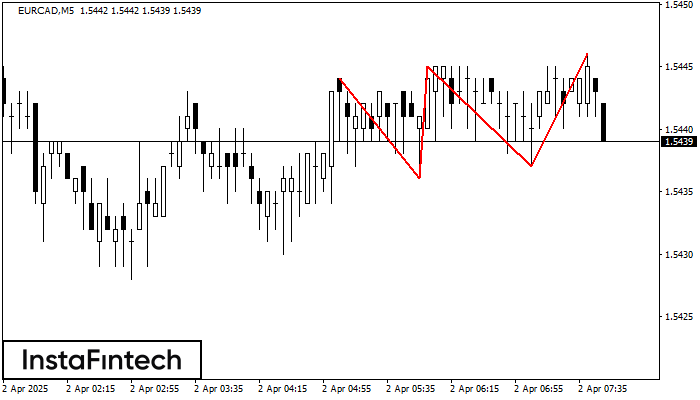
The Triple Top pattern has formed on the chart of the EURCAD M5. Features of the pattern: borders have an ascending angle; the lower line of the pattern has the coordinates 1.5436/1.5437 with the upper limit 1.5444/1.5446; the projection of the width is 8 points. The formation of the Triple Top figure most likely indicates a change in the trend from upward to downward. This means that in the event of a breakdown of the support level of 1.5436, the price is most likely to continue the downward movement.
The M5 and M15 time frames may have more false entry points.
- All
- All
- Bearish Rectangle
- Bearish Symmetrical Triangle
- Bearish Symmetrical Triangle
- Bullish Rectangle
- Double Top
- Double Top
- Triple Bottom
- Triple Bottom
- Triple Top
- Triple Top
- All
- All
- Buy
- Sale
- All
- 1
- 2
- 3
- 4
- 5
Double Top
сформирован 14.05 в 02:30:37 (UTC+0)
сила сигнала 3 из 5
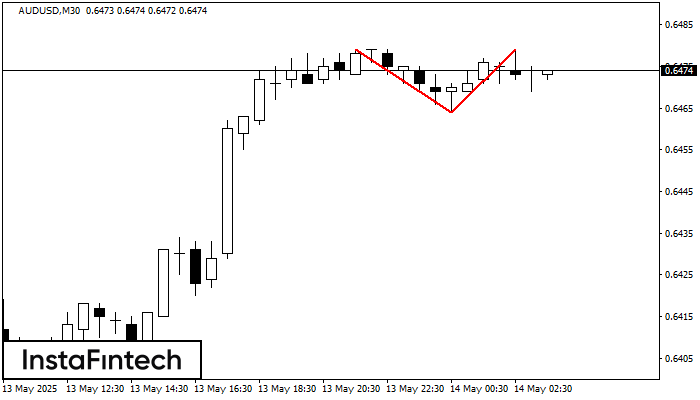
The Double Top pattern has been formed on AUDUSD M30. It signals that the trend has been changed from upwards to downwards. Probably, if the base of the pattern 0.6464
Открыть график инструмента в новом окне
Bullish Rectangle
сформирован 14.05 в 02:29:26 (UTC+0)
сила сигнала 2 из 5
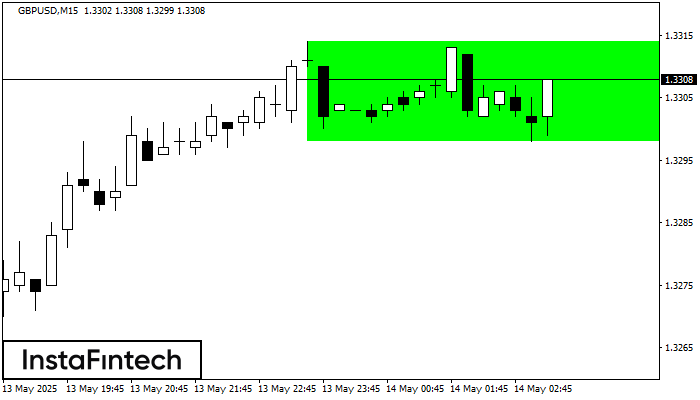
According to the chart of M15, GBPUSD formed the Bullish Rectangle. This type of a pattern indicates a trend continuation. It consists of two levels: resistance 1.3314 and support 1.3298
The M5 and M15 time frames may have more false entry points.
Открыть график инструмента в новом окне
Double Top
сформирован 14.05 в 02:15:18 (UTC+0)
сила сигнала 2 из 5
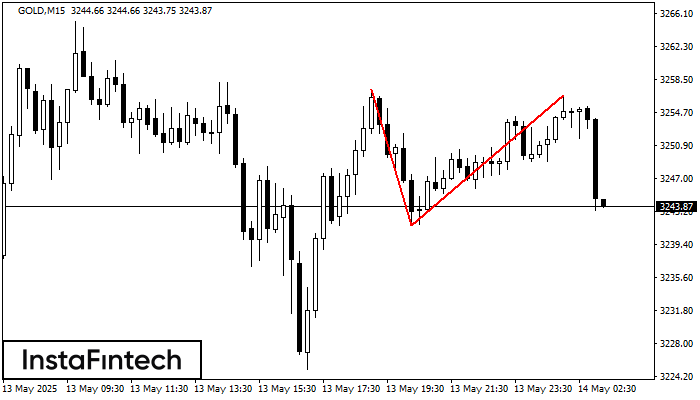
The Double Top reversal pattern has been formed on GOLD M15. Characteristics: the upper boundary 3257.36; the lower boundary 3241.62; the width of the pattern is 1504 points. Sell trades
The M5 and M15 time frames may have more false entry points.
Открыть график инструмента в новом окне


