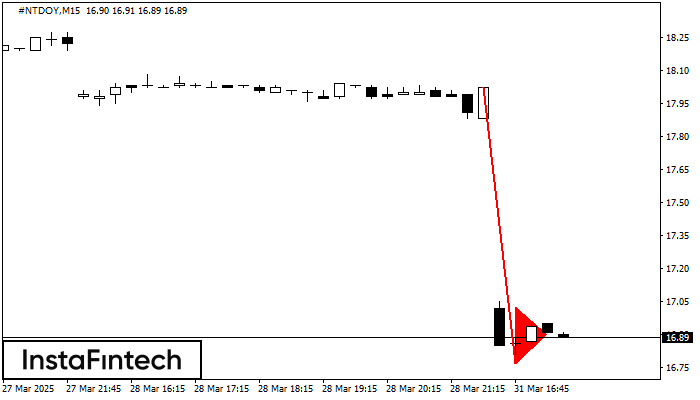
Bearish pennant
was formed on 31.03 at 16:30:30 (UTC+0)
signal strength 2 of 5

The Bearish pennant pattern has formed on the #NTDOY M15 chart. This pattern type is characterized by a slight slowdown after which the price will move in the direction of the original trend. In case the price fixes below the pattern’s low of 16.77, a trader will be able to successfully enter the sell position.
The M5 and M15 time frames may have more false entry points.
- All
- All
- Bearish Rectangle
- Bearish Symmetrical Triangle
- Bearish Symmetrical Triangle
- Bullish Rectangle
- Double Top
- Double Top
- Triple Bottom
- Triple Bottom
- Triple Top
- Triple Top
- All
- All
- Buy
- Sale
- All
- 1
- 2
- 3
- 4
- 5
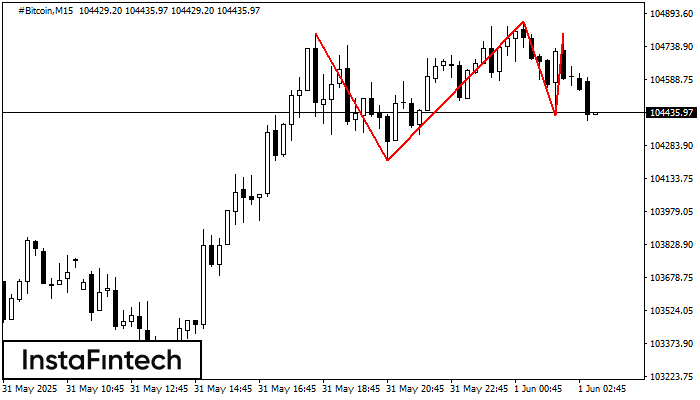
Topo triplo
was formed on 01.06 at 02:15:04 (UTC+0)
signal strength 2 of 5
No gráfico do instrumento de negociação #Bitcoin M15, o padrão Topo triplo que sinaliza uma mudança de tendência se formou. É possível que após a formação do terceiro pico
Os intervalos M5 e M15 podem ter mais pontos de entrada falsos.
Open chart in a new window
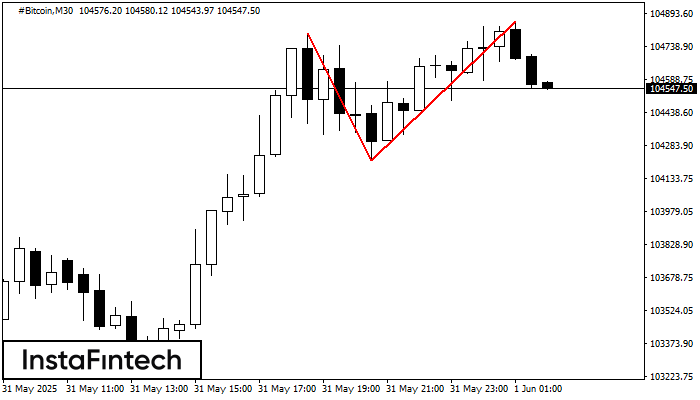
Topo duplo
was formed on 01.06 at 01:00:35 (UTC+0)
signal strength 3 of 5
O padrão de reversão Topo duplo foi formado em #Bitcoin M30. Características: o limite superior 104800.13; o limite inferior 104215.56; a largura do padrão é de 64024 pontos. As operações
Open chart in a new window
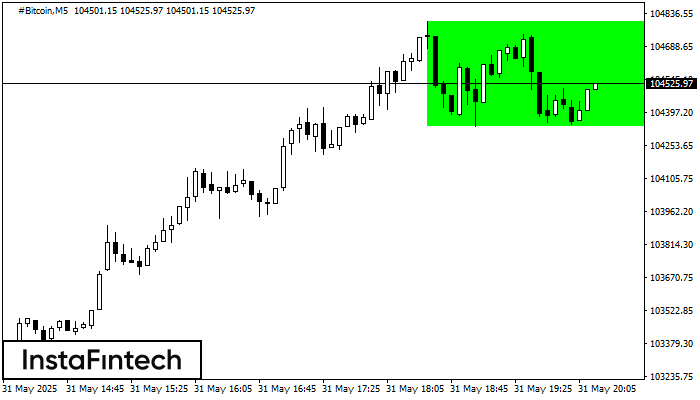
Retângulo de alta
was formed on 31.05 at 19:15:46 (UTC+0)
signal strength 1 of 5
De acordo com o gráfico de M5, #Bitcoin formou o Retângulo de alta que é um padrão de uma continuação da tendência. O padrão está dentro dos seguintes limites
Os intervalos M5 e M15 podem ter mais pontos de entrada falsos.
Open chart in a new window


