

Padrões atuais

Padrões são modelos gráficos que são formados no gráfico pelo preço. Segundo um dos postulados da análise técnica, a história (movimento de preços) se repete. Isso significa que os movimentos de preços geralmente são semelhantes nas mesmas situações, o que possibilita prever o desenvolvimento futuro da situação com alta probabilidade.
Os padrões relevantes da InstaTrade são um serviço fácil de usar, que permite que você esteja ciente das últimas mudanças no mercado e reaja a indícios do mercado a tempo. Em nosso serviço, você sempre encontrará os padrões mais recentes e relevantes em qualquer par e em qualquer período gráfico.
Bullish Symmetrical Triangle
was formed on 31.03 at 14:00:41 (UTC+0)
signal strength 2 of 5
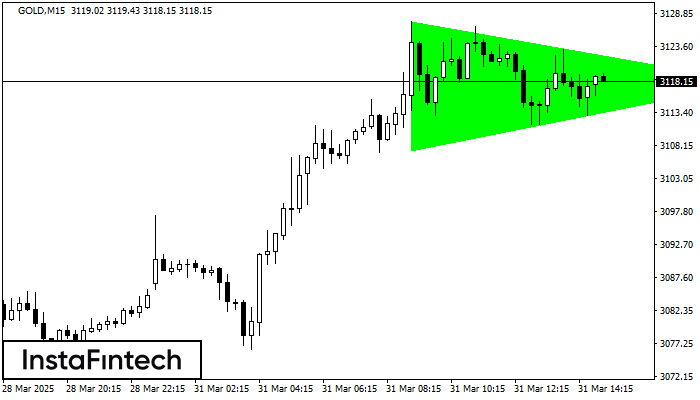
According to the chart of M15, GOLD formed the Bullish Symmetrical Triangle pattern. Description: This is the pattern of a trend continuation. 3127.49 and 3107.40 are the coordinates of the upper and lower borders respectively. The pattern width is measured on the chart at 2009 pips. Outlook: If the upper border 3127.49 is broken, the price is likely to continue its move by 3118.29.
The M5 and M15 time frames may have more false entry points.
- All
- All
- Bearish Rectangle
- Bearish Symmetrical Triangle
- Bearish Symmetrical Triangle
- Bullish Rectangle
- Double Top
- Double Top
- Triple Bottom
- Triple Bottom
- Triple Top
- Triple Top
- All
- All
- Buy
- Sale
- All
- 1
- 2
- 3
- 4
- 5
Topo duplo
was formed on 23.05 at 19:00:11 (UTC+0)
signal strength 1 of 5
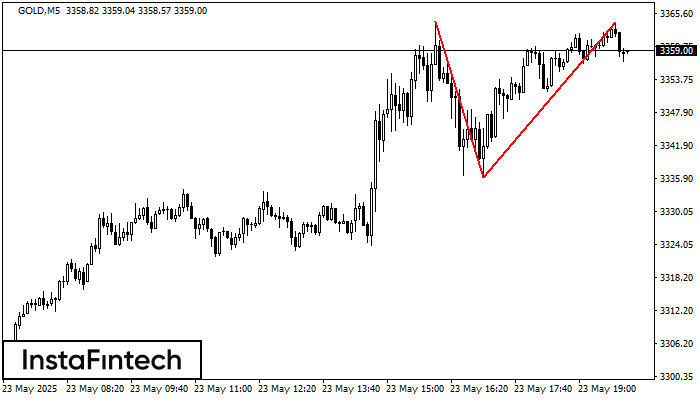
No gráfico de GOLD M5 o padrão de reversão Topo duplo foi formado. Características: o limite superior 3364.14; o limite inferior 3336.09; a largura do padrão 2805 pontos. O sinal
Os intervalos M5 e M15 podem ter mais pontos de entrada falsos.
Open chart in a new window
Bandeira de Alta
was formed on 23.05 at 18:36:49 (UTC+0)
signal strength 1 of 5
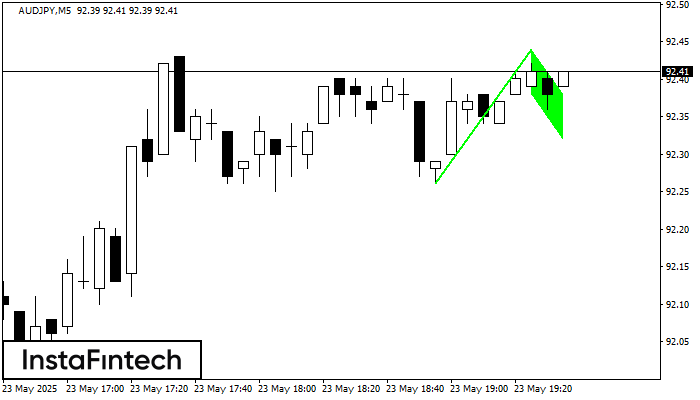
O padrão Bandeira de Alta foi formado em AUDJPY a M5. O limite inferior do padrão está localizado em 92.38/92.32, enquanto o limite superior está em 92.44/92.38. A projeção
Os intervalos M5 e M15 podem ter mais pontos de entrada falsos.
Open chart in a new window
Pennant de alta
was formed on 23.05 at 18:36:43 (UTC+0)
signal strength 1 of 5
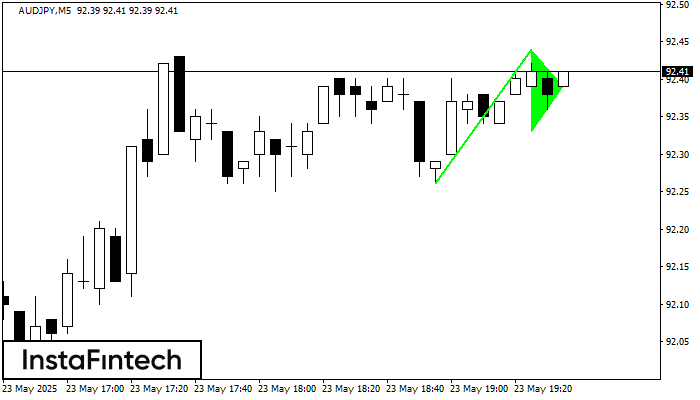
O padrão Pennant de alta é formado no gráfico AUDJPY M5. Ele é um tipo do padrão de continuação. Supostamente, se o preço for fixado acima da alta de 92.44
Os intervalos M5 e M15 podem ter mais pontos de entrada falsos.
Open chart in a new window


