

Padrões atuais

Padrões são modelos gráficos que são formados no gráfico pelo preço. Segundo um dos postulados da análise técnica, a história (movimento de preços) se repete. Isso significa que os movimentos de preços geralmente são semelhantes nas mesmas situações, o que possibilita prever o desenvolvimento futuro da situação com alta probabilidade.
Os padrões relevantes da InstaTrade são um serviço fácil de usar, que permite que você esteja ciente das últimas mudanças no mercado e reaja a indícios do mercado a tempo. Em nosso serviço, você sempre encontrará os padrões mais recentes e relevantes em qualquer par e em qualquer período gráfico.
Double Bottom
was formed on 30.03 at 23:00:20 (UTC+0)
signal strength 3 of 5
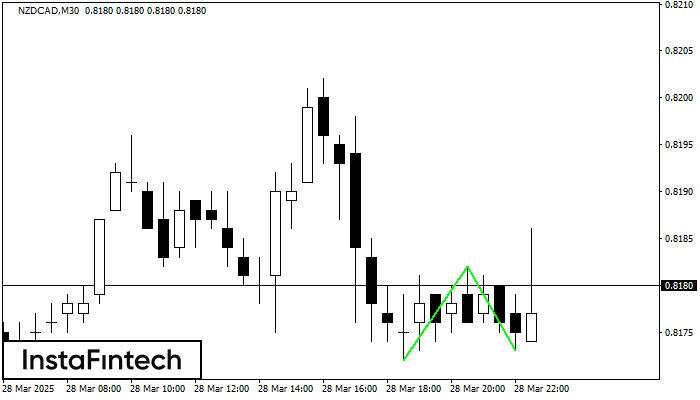
The Double Bottom pattern has been formed on NZDCAD M30. This formation signals a reversal of the trend from downwards to upwards. The signal is that a buy trade should be opened after the upper boundary of the pattern 0.8182 is broken. The further movements will rely on the width of the current pattern 10 points.
- All
- All
- Bearish Rectangle
- Bearish Symmetrical Triangle
- Bearish Symmetrical Triangle
- Bullish Rectangle
- Double Top
- Double Top
- Triple Bottom
- Triple Bottom
- Triple Top
- Triple Top
- All
- All
- Buy
- Sale
- All
- 1
- 2
- 3
- 4
- 5
Fundo duplo
was formed on 13.05 at 05:00:05 (UTC+0)
signal strength 4 of 5
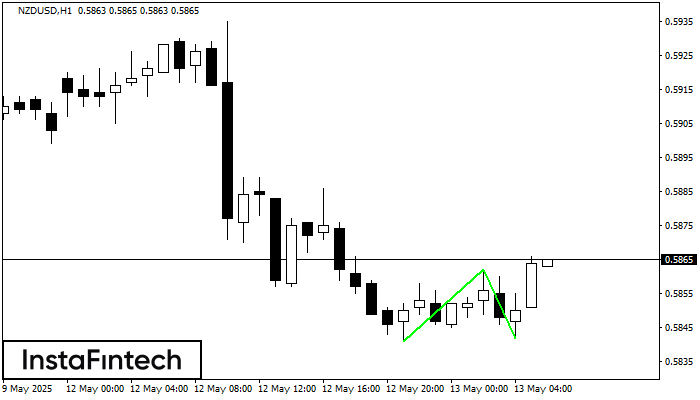
O padrão Fundo duplo foi formado em NZDUSD H1; o limite superior é 0.5862; o limite inferior é 0.5842. A largura do padrão é de 21 pontos. No caso
Open chart in a new window
Fundo duplo
was formed on 13.05 at 04:59:55 (UTC+0)
signal strength 3 of 5
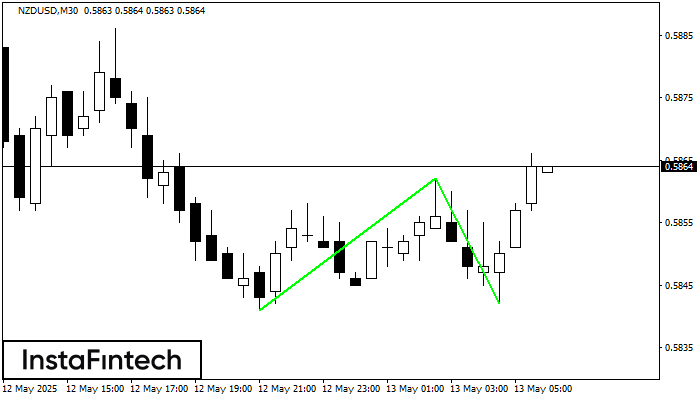
O padrão Fundo duplo foi formado em NZDUSD M30. Esta formação sinaliza uma reversão da tendência de baixo para cima. O sinal é que uma negociação de compra deve
Open chart in a new window
Fundo duplo
was formed on 13.05 at 04:29:54 (UTC+0)
signal strength 3 of 5
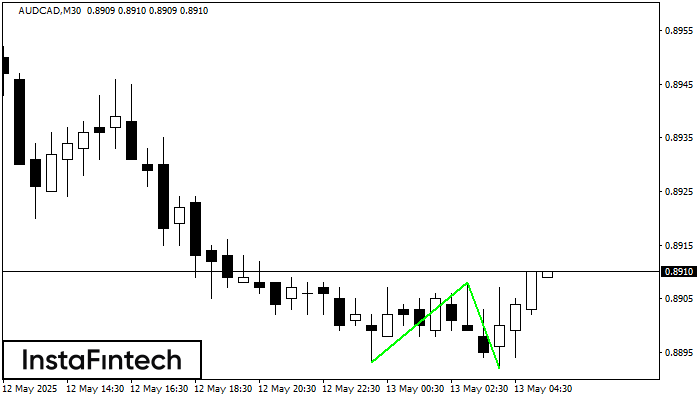
O padrão Fundo duplo foi formado em AUDCAD M30. Esta formação sinaliza uma reversão da tendência de baixo para cima. O sinal é que uma negociação de compra deve
Open chart in a new window


