

Padrões atuais

Padrões são modelos gráficos que são formados no gráfico pelo preço. Segundo um dos postulados da análise técnica, a história (movimento de preços) se repete. Isso significa que os movimentos de preços geralmente são semelhantes nas mesmas situações, o que possibilita prever o desenvolvimento futuro da situação com alta probabilidade.
Os padrões relevantes da InstaTrade são um serviço fácil de usar, que permite que você esteja ciente das últimas mudanças no mercado e reaja a indícios do mercado a tempo. Em nosso serviço, você sempre encontrará os padrões mais recentes e relevantes em qualquer par e em qualquer período gráfico.
Bullish Rectangle
was formed on 28.03 at 22:34:02 (UTC+0)
signal strength 3 of 5

According to the chart of M30, GOLD formed the Bullish Rectangle which is a pattern of a trend continuation. The pattern is contained within the following borders: the lower border 3065.51 – 3065.51 and upper border 3086.32 – 3086.32. In case the upper border is broken, the instrument is likely to follow the upward trend.
Veja também
- All
- All
- Bearish Rectangle
- Bearish Symmetrical Triangle
- Bearish Symmetrical Triangle
- Bullish Rectangle
- Double Top
- Double Top
- Triple Bottom
- Triple Bottom
- Triple Top
- Triple Top
- All
- All
- Buy
- Sale
- All
- 1
- 2
- 3
- 4
- 5
Fundo triplo
was formed on 19.05 at 19:30:18 (UTC+0)
signal strength 1 of 5
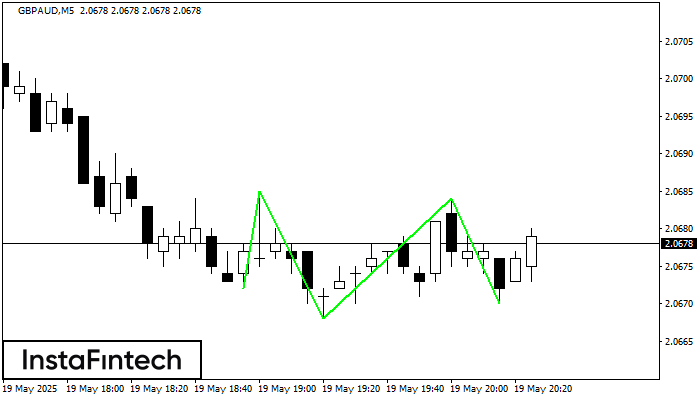
O padrão Fundo triplo foi formado em GBPAUD M5. Possui as seguintes características: nível de resistência 2.0685/2.0684; nível de suporte 2.0672/2.0670; a largura é de 13 pontos. Se houver
Os intervalos M5 e M15 podem ter mais pontos de entrada falsos.
Open chart in a new window
Fundo duplo
was formed on 19.05 at 19:20:16 (UTC+0)
signal strength 1 of 5
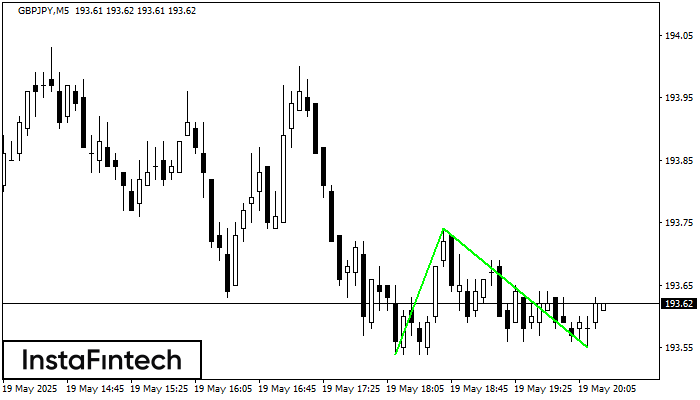
O padrão Fundo duplo foi formado em GBPJPY M5. Esta formação sinaliza uma reversão da tendência de baixo para cima. O sinal é que uma negociação de compra deve
Os intervalos M5 e M15 podem ter mais pontos de entrada falsos.
Open chart in a new window
Topo triplo
was formed on 19.05 at 19:16:13 (UTC+0)
signal strength 1 of 5
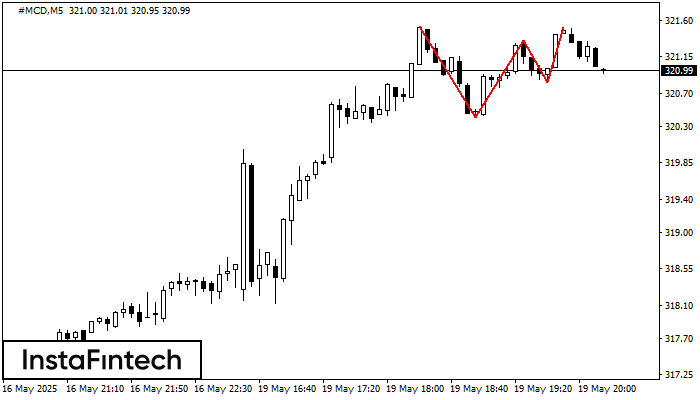
No gráfico do instrumento de negociação #MCD M5, o padrão Topo triplo que sinaliza uma mudança de tendência se formou. É possível que após a formação do terceiro pico
Os intervalos M5 e M15 podem ter mais pontos de entrada falsos.
Open chart in a new window


