

Padrões atuais

Padrões são modelos gráficos que são formados no gráfico pelo preço. Segundo um dos postulados da análise técnica, a história (movimento de preços) se repete. Isso significa que os movimentos de preços geralmente são semelhantes nas mesmas situações, o que possibilita prever o desenvolvimento futuro da situação com alta probabilidade.
Os padrões relevantes da InstaTrade são um serviço fácil de usar, que permite que você esteja ciente das últimas mudanças no mercado e reaja a indícios do mercado a tempo. Em nosso serviço, você sempre encontrará os padrões mais recentes e relevantes em qualquer par e em qualquer período gráfico.
Triple Bottom
was formed on 28.03 at 19:46:37 (UTC+0)
signal strength 1 of 5
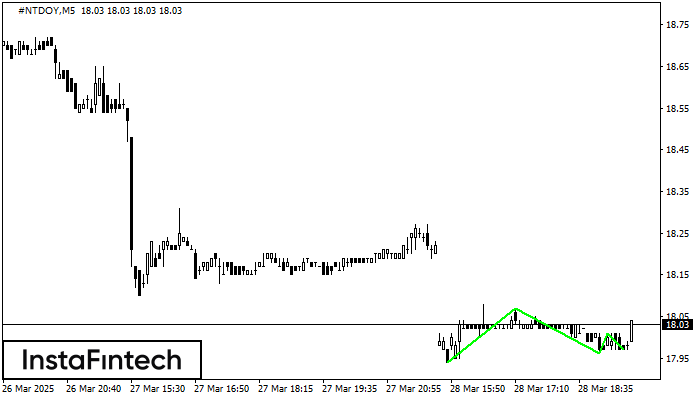
The Triple Bottom pattern has formed on the chart of the #NTDOY M5 trading instrument. The pattern signals a change in the trend from downwards to upwards in the case of breakdown of 18.07/18.01.
The M5 and M15 time frames may have more false entry points.
- All
- All
- Bearish Rectangle
- Bearish Symmetrical Triangle
- Bearish Symmetrical Triangle
- Bullish Rectangle
- Double Top
- Double Top
- Triple Bottom
- Triple Bottom
- Triple Top
- Triple Top
- All
- All
- Buy
- Sale
- All
- 1
- 2
- 3
- 4
- 5
Double Bottom
сформирован 13.06 в 18:45:28 (UTC+0)
сила сигнала 1 из 5
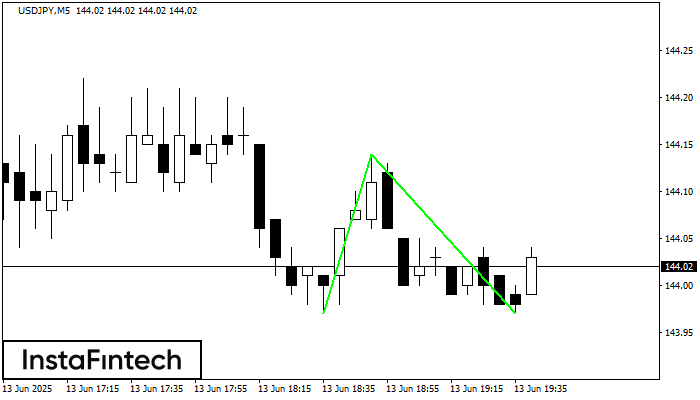
The Double Bottom pattern has been formed on USDJPY M5. This formation signals a reversal of the trend from downwards to upwards. The signal is that a buy trade should
The M5 and M15 time frames may have more false entry points.
Открыть график инструмента в новом окне
Double Top
сформирован 13.06 в 18:30:20 (UTC+0)
сила сигнала 1 из 5
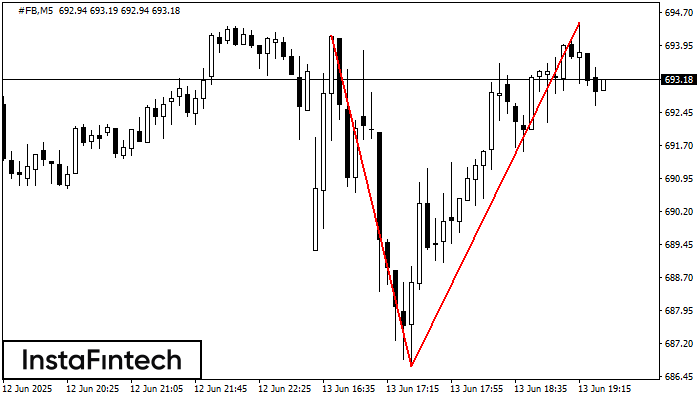
On the chart of #FB M5 the Double Top reversal pattern has been formed. Characteristics: the upper boundary 694.47; the lower boundary 686.69; the width of the pattern 778 points
The M5 and M15 time frames may have more false entry points.
Открыть график инструмента в новом окне
Bullish Rectangle
сформирован 13.06 в 18:21:09 (UTC+0)
сила сигнала 1 из 5
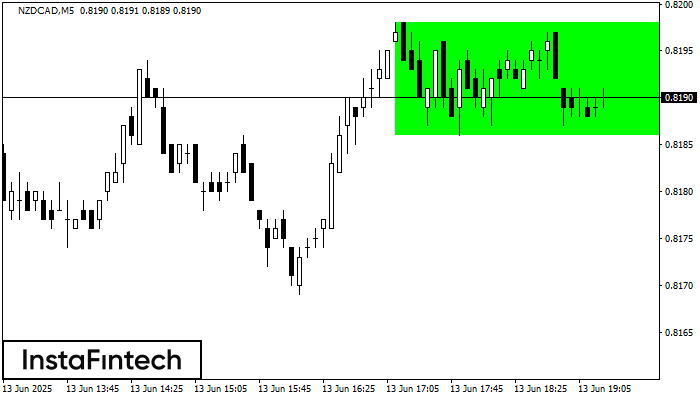
According to the chart of M5, NZDCAD formed the Bullish Rectangle which is a pattern of a trend continuation. The pattern is contained within the following borders: the lower border
The M5 and M15 time frames may have more false entry points.
Открыть график инструмента в новом окне


