

Padrões atuais

Padrões são modelos gráficos que são formados no gráfico pelo preço. Segundo um dos postulados da análise técnica, a história (movimento de preços) se repete. Isso significa que os movimentos de preços geralmente são semelhantes nas mesmas situações, o que possibilita prever o desenvolvimento futuro da situação com alta probabilidade.
Os padrões relevantes da InstaTrade são um serviço fácil de usar, que permite que você esteja ciente das últimas mudanças no mercado e reaja a indícios do mercado a tempo. Em nosso serviço, você sempre encontrará os padrões mais recentes e relevantes em qualquer par e em qualquer período gráfico.
Triple Top
was formed on 26.03 at 14:05:08 (UTC+0)
signal strength 1 of 5
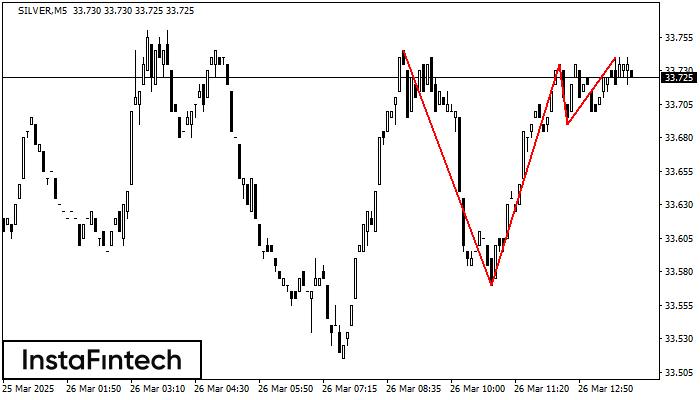
The Triple Top pattern has formed on the chart of the SILVER M5. Features of the pattern: borders have an ascending angle; the lower line of the pattern has the coordinates 33.57/33.69 with the upper limit 33.74/33.74; the projection of the width is 175 points. The formation of the Triple Top figure most likely indicates a change in the trend from upward to downward. This means that in the event of a breakdown of the support level of 33.57, the price is most likely to continue the downward movement.
The M5 and M15 time frames may have more false entry points.
- All
- All
- Bearish Rectangle
- Bearish Symmetrical Triangle
- Bearish Symmetrical Triangle
- Bullish Rectangle
- Double Top
- Double Top
- Triple Bottom
- Triple Bottom
- Triple Top
- Triple Top
- All
- All
- Buy
- Sale
- All
- 1
- 2
- 3
- 4
- 5
Triângulo Simétrico de Alta
was formed on 02.06 at 09:22:12 (UTC+0)
signal strength 4 of 5

De acordo com o gráfico de H1, EURJPY formou o padrão de Triângulo Simétrico de Alta. O limite inferior do padrão toca as coordenadas 162.28/163.37 enquanto o limite superior cruza
Open chart in a new window
Fundo duplo
was formed on 02.06 at 09:00:13 (UTC+0)
signal strength 3 of 5

O padrão Fundo duplo foi formado em GBPJPY M30. Características: o nível de suporte 193.37; o nível de resistência 194.63; a largura do padrão 126 pontos. Se o nível
Open chart in a new window
Fundo duplo
was formed on 02.06 at 09:00:05 (UTC+0)
signal strength 4 of 5
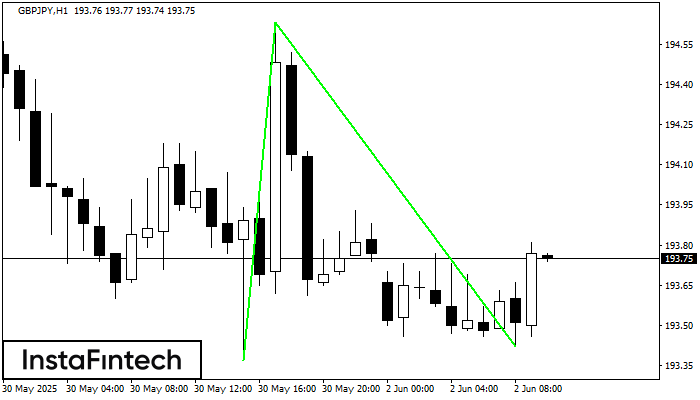
O padrão Fundo duplo foi formado em GBPJPY H1. Esta formação sinaliza uma reversão da tendência de baixo para cima. O sinal é que uma negociação de compra deve
Open chart in a new window


