

Padrões atuais

Padrões são modelos gráficos que são formados no gráfico pelo preço. Segundo um dos postulados da análise técnica, a história (movimento de preços) se repete. Isso significa que os movimentos de preços geralmente são semelhantes nas mesmas situações, o que possibilita prever o desenvolvimento futuro da situação com alta probabilidade.
Os padrões relevantes da InstaTrade são um serviço fácil de usar, que permite que você esteja ciente das últimas mudanças no mercado e reaja a indícios do mercado a tempo. Em nosso serviço, você sempre encontrará os padrões mais recentes e relevantes em qualquer par e em qualquer período gráfico.
Double Top
was formed on 26.03 at 10:30:57 (UTC+0)
signal strength 3 of 5
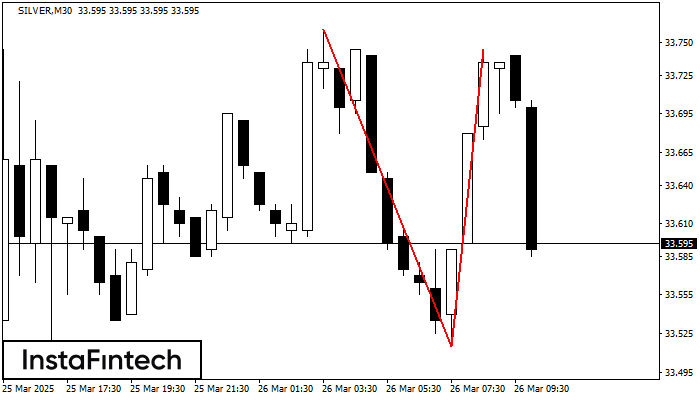
On the chart of SILVER M30 the Double Top reversal pattern has been formed. Characteristics: the upper boundary 33.74; the lower boundary 33.52; the width of the pattern 230 points. The signal: a break of the lower boundary will cause continuation of the downward trend targeting the 33.48 level.
- All
- All
- Bearish Rectangle
- Bearish Symmetrical Triangle
- Bearish Symmetrical Triangle
- Bullish Rectangle
- Double Top
- Double Top
- Triple Bottom
- Triple Bottom
- Triple Top
- Triple Top
- All
- All
- Buy
- Sale
- All
- 1
- 2
- 3
- 4
- 5
Fundo triplo
was formed on 17.05 at 17:00:17 (UTC+0)
signal strength 3 of 5

O padrão Fundo triplo foi formado em #Bitcoin M30. Possui as seguintes características: nível de resistência 103658.13/103057.03; nível de suporte 102549.85/102590.27; a largura é de 110828 pontos. Se houver
Open chart in a new window
Cabeça & Ombro Invertidos
was formed on 17.05 at 05:40:01 (UTC+0)
signal strength 1 of 5

De acordo com o gráfico de M5, #Bitcoin produziu o padrão denominado Cabeça & Ombro Invertidos. A Cabeça é definida em 102549.85 enquanto a linha mediana do Pescoço é definida
Os intervalos M5 e M15 podem ter mais pontos de entrada falsos.
Open chart in a new window
Fundo duplo
was formed on 17.05 at 02:15:26 (UTC+0)
signal strength 1 of 5

O padrão Fundo duplo foi formado em #Bitcoin M5; o limite superior é 103642.04; o limite inferior é 103357.83. A largura do padrão é de 27887 pontos. No caso
Os intervalos M5 e M15 podem ter mais pontos de entrada falsos.
Open chart in a new window


