

Padrões atuais

Padrões são modelos gráficos que são formados no gráfico pelo preço. Segundo um dos postulados da análise técnica, a história (movimento de preços) se repete. Isso significa que os movimentos de preços geralmente são semelhantes nas mesmas situações, o que possibilita prever o desenvolvimento futuro da situação com alta probabilidade.
Os padrões relevantes da InstaTrade são um serviço fácil de usar, que permite que você esteja ciente das últimas mudanças no mercado e reaja a indícios do mercado a tempo. Em nosso serviço, você sempre encontrará os padrões mais recentes e relevantes em qualquer par e em qualquer período gráfico.
Double Top
was formed on 26.03 at 05:30:20 (UTC+0)
signal strength 3 of 5
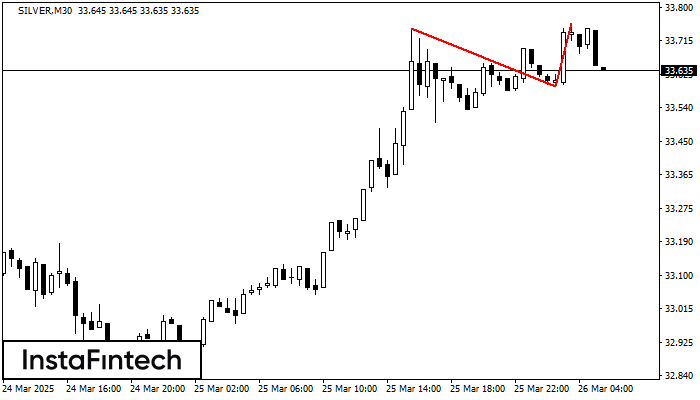
On the chart of SILVER M30 the Double Top reversal pattern has been formed. Characteristics: the upper boundary 33.76; the lower boundary 33.59; the width of the pattern 165 points. The signal: a break of the lower boundary will cause continuation of the downward trend targeting the 33.56 level.
Veja também
- All
- All
- Bearish Rectangle
- Bearish Symmetrical Triangle
- Bearish Symmetrical Triangle
- Bullish Rectangle
- Double Top
- Double Top
- Triple Bottom
- Triple Bottom
- Triple Top
- Triple Top
- All
- All
- Buy
- Sale
- All
- 1
- 2
- 3
- 4
- 5
Triple Top
was formed on 21.05 at 20:55:11 (UTC+0)
signal strength 1 of 5
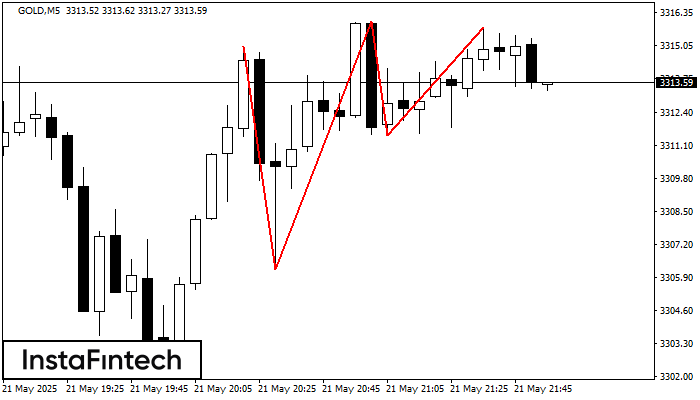
On the chart of the GOLD M5 trading instrument, the Triple Top pattern that signals a trend change has formed. It is possible that after formation of the third peak
The M5 and M15 time frames may have more false entry points.
Open chart in a new window
Double Top
was formed on 21.05 at 20:30:53 (UTC+0)
signal strength 3 of 5
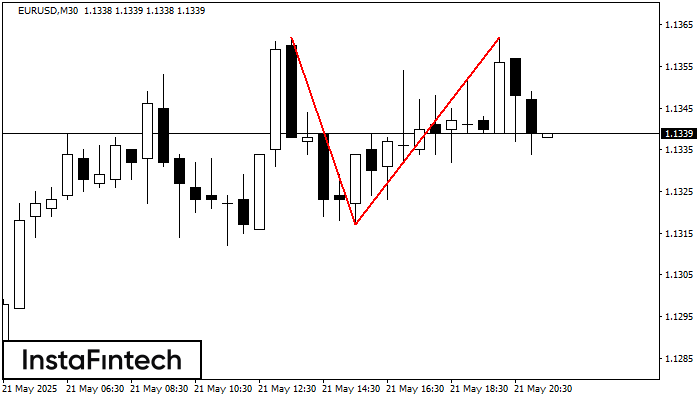
The Double Top pattern has been formed on EURUSD M30. It signals that the trend has been changed from upwards to downwards. Probably, if the base of the pattern 1.1317
Open chart in a new window
Bearish Rectangle
was formed on 21.05 at 19:30:17 (UTC+0)
signal strength 4 of 5
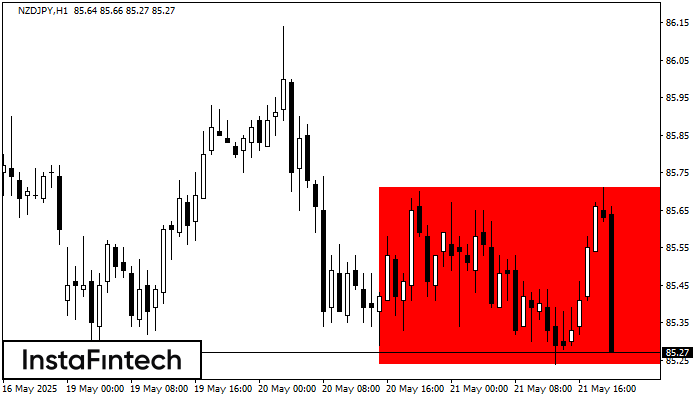
According to the chart of H1, NZDJPY formed the Bearish Rectangle which is a pattern of a trend continuation. The pattern is contained within the following borders: lower border 85.24
Open chart in a new window


