

Padrões atuais

Padrões são modelos gráficos que são formados no gráfico pelo preço. Segundo um dos postulados da análise técnica, a história (movimento de preços) se repete. Isso significa que os movimentos de preços geralmente são semelhantes nas mesmas situações, o que possibilita prever o desenvolvimento futuro da situação com alta probabilidade.
Os padrões relevantes da InstaTrade são um serviço fácil de usar, que permite que você esteja ciente das últimas mudanças no mercado e reaja a indícios do mercado a tempo. Em nosso serviço, você sempre encontrará os padrões mais recentes e relevantes em qualquer par e em qualquer período gráfico.
Head and Shoulders
was formed on 25.03 at 03:30:30 (UTC+0)
signal strength 2 of 5

The #Bitcoin M15 formed the Head and Shoulders pattern with the following features: The Head’s top is at 88742.88, the Neckline and the upward angle are at 87100.22/87010.53. The formation of this pattern can bring about changes in the current trend from bullish to bearish. In case the pattern triggers the expected changes, the price of #Bitcoin will go towards 87010.30.
The M5 and M15 time frames may have more false entry points.
- All
- All
- Bearish Rectangle
- Bearish Symmetrical Triangle
- Bearish Symmetrical Triangle
- Bullish Rectangle
- Double Top
- Double Top
- Triple Bottom
- Triple Bottom
- Triple Top
- Triple Top
- All
- All
- Buy
- Sale
- All
- 1
- 2
- 3
- 4
- 5
Topo duplo
was formed on 02.06 at 02:00:45 (UTC+0)
signal strength 2 of 5
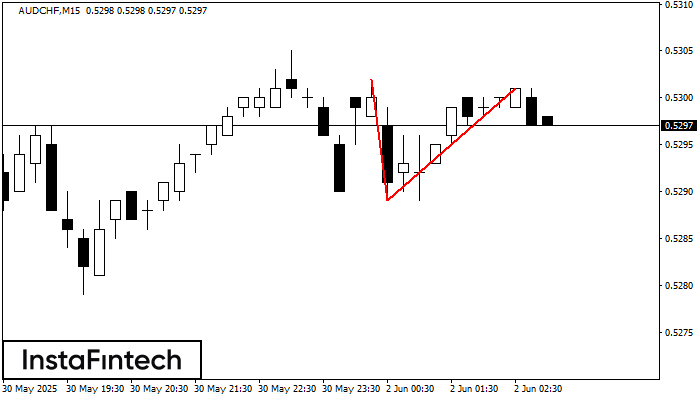
No gráfico de AUDCHF M15 o padrão de reversão Topo duplo foi formado. Características: o limite superior 0.5301; o limite inferior 0.5289; a largura do padrão 12 pontos. O sinal
Os intervalos M5 e M15 podem ter mais pontos de entrada falsos.
Open chart in a new window
Topo duplo
was formed on 02.06 at 02:00:22 (UTC+0)
signal strength 3 of 5
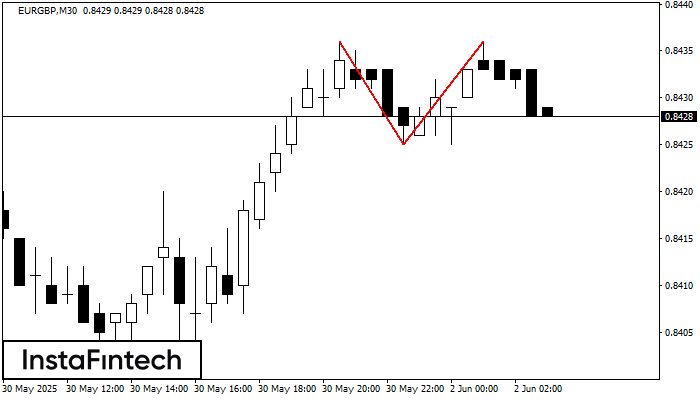
O padrão Topo duplo foi formado em EURGBP M30. Isso sinaliza que a tendência foi alterada de cima para baixo. Provavelmente, se a base do padrão 0.8425 for quebrada
Open chart in a new window
Fundo duplo
was formed on 02.06 at 01:50:23 (UTC+0)
signal strength 1 of 5
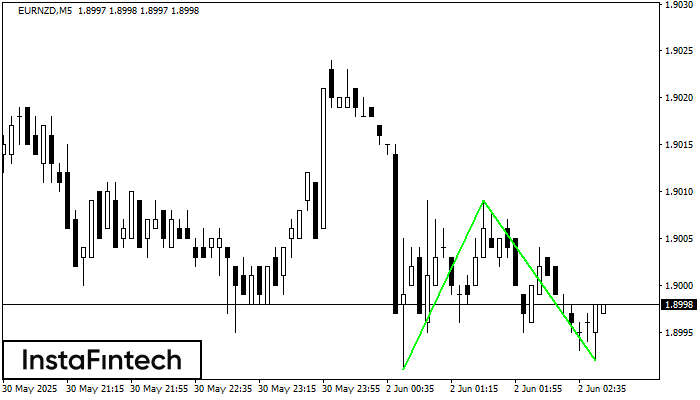
O padrão Fundo duplo foi formado em EURNZD M5. Esta formação sinaliza uma reversão da tendência de baixo para cima. O sinal é que uma negociação de compra deve
Os intervalos M5 e M15 podem ter mais pontos de entrada falsos.
Open chart in a new window


