

Padrões atuais

Padrões são modelos gráficos que são formados no gráfico pelo preço. Segundo um dos postulados da análise técnica, a história (movimento de preços) se repete. Isso significa que os movimentos de preços geralmente são semelhantes nas mesmas situações, o que possibilita prever o desenvolvimento futuro da situação com alta probabilidade.
Os padrões relevantes da InstaTrade são um serviço fácil de usar, que permite que você esteja ciente das últimas mudanças no mercado e reaja a indícios do mercado a tempo. Em nosso serviço, você sempre encontrará os padrões mais recentes e relevantes em qualquer par e em qualquer período gráfico.
Bullish Symmetrical Triangle
was formed on 23.03 at 23:37:34 (UTC+0)
signal strength 1 of 5
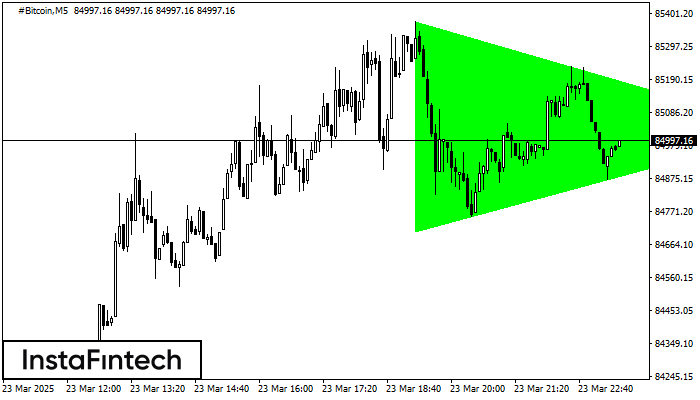
According to the chart of M5, #Bitcoin formed the Bullish Symmetrical Triangle pattern, which signals the trend will continue. Description. The upper border of the pattern touches the coordinates 85375.58/85027.71 whereas the lower border goes across 84707.51/85027.71. The pattern width is measured on the chart at 66807 pips. If the Bullish Symmetrical Triangle pattern is in progress during the upward trend, this indicates the current trend will go on. In case 85027.71 is broken, the price could continue its move toward 85027.86.
The M5 and M15 time frames may have more false entry points.
- All
- All
- Bearish Rectangle
- Bearish Symmetrical Triangle
- Bearish Symmetrical Triangle
- Bullish Rectangle
- Double Top
- Double Top
- Triple Bottom
- Triple Bottom
- Triple Top
- Triple Top
- All
- All
- Buy
- Sale
- All
- 1
- 2
- 3
- 4
- 5
Медвежий симметричный треугольник
сформирован 25.04 в 02:17:26 (UTC+0)
сила сигнала 2 из 5
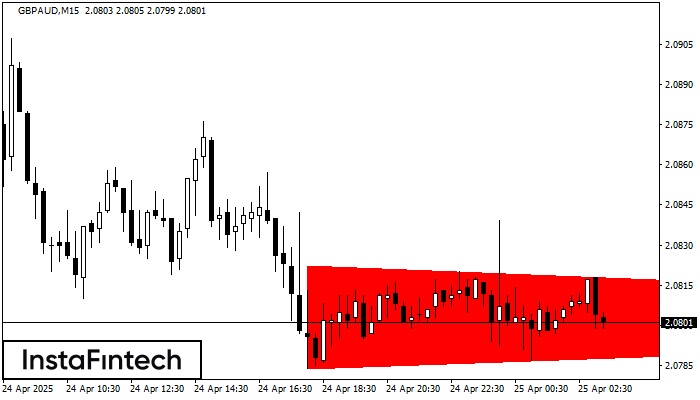
На графике GBPAUD M15 сформировалась фигура «Медвежий симметричный треугольник». Характеристика фигуры: Нижняя граница 2.0784/2.0802; Верхняя граница 2.0822/2.0802; Проекция ширины фигуры -38 пунктов. Формирование фигуры «Медвежий симметричный треугольник» наиболее вероятным образом
Таймфреймы М5 и М15 могут иметь больше ложных точек входа.
Открыть график инструмента в новом окне
Двойное дно
сформирован 25.04 в 01:59:57 (UTC+0)
сила сигнала 3 из 5
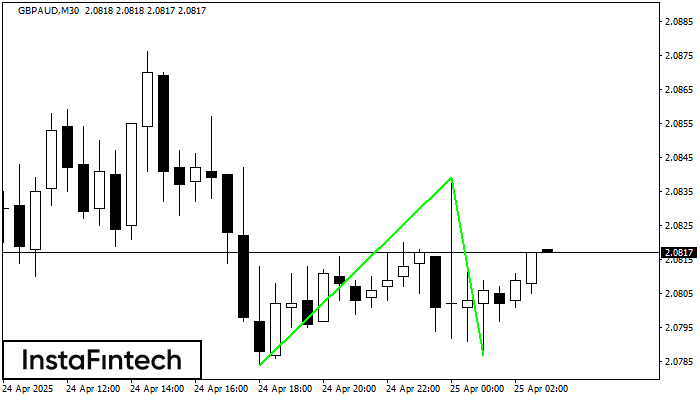
Сформирована фигура «Двойное дно» на графике GBPAUD M30. Характеристика: Уровень поддержки 2.0784; Уровень сопротивления 2.0839; Ширина фигуры 55 пунктов. В случае пробоя уровня сопротивления можно будет прогнозировать изменение тенденции
Открыть график инструмента в новом окне
Двойная вершина
сформирован 25.04 в 01:45:13 (UTC+0)
сила сигнала 2 из 5
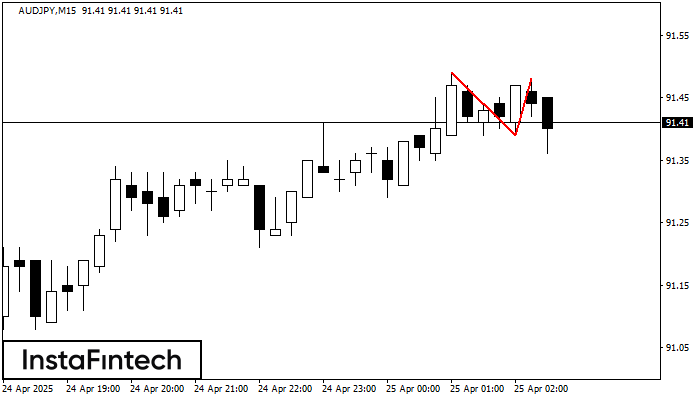
На торговом графике AUDJPY M15 сформировалась разворотная фигура «Двойная вершина». Характеристика: Верхняя граница 91.48; Нижняя граница 91.39; Ширина фигуры 9 пунктов. Сигнал: Пробой нижней границы 91.39 приведет к дальнейшему нисходящему
Таймфреймы М5 и М15 могут иметь больше ложных точек входа.
Открыть график инструмента в новом окне


