

Padrões atuais

Padrões são modelos gráficos que são formados no gráfico pelo preço. Segundo um dos postulados da análise técnica, a história (movimento de preços) se repete. Isso significa que os movimentos de preços geralmente são semelhantes nas mesmas situações, o que possibilita prever o desenvolvimento futuro da situação com alta probabilidade.
Os padrões relevantes da InstaTrade são um serviço fácil de usar, que permite que você esteja ciente das últimas mudanças no mercado e reaja a indícios do mercado a tempo. Em nosso serviço, você sempre encontrará os padrões mais recentes e relevantes em qualquer par e em qualquer período gráfico.
Bullish Symmetrical Triangle
was formed on 21.03 at 04:06:31 (UTC+0)
signal strength 1 of 5
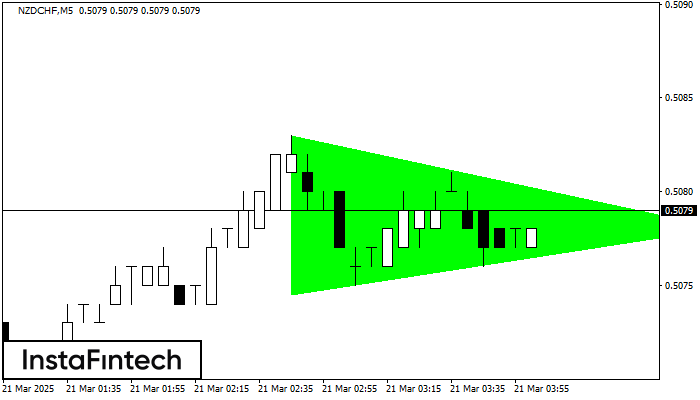
According to the chart of M5, NZDCHF formed the Bullish Symmetrical Triangle pattern. Description: This is the pattern of a trend continuation. 0.5083 and 0.5075 are the coordinates of the upper and lower borders respectively. The pattern width is measured on the chart at 8 pips. Outlook: If the upper border 0.5083 is broken, the price is likely to continue its move by 0.5093.
The M5 and M15 time frames may have more false entry points.
- All
- All
- Bearish Rectangle
- Bearish Symmetrical Triangle
- Bearish Symmetrical Triangle
- Bullish Rectangle
- Double Top
- Double Top
- Triple Bottom
- Triple Bottom
- Triple Top
- Triple Top
- All
- All
- Buy
- Sale
- All
- 1
- 2
- 3
- 4
- 5
Fundo duplo
was formed on 20.05 at 00:45:31 (UTC+0)
signal strength 1 of 5
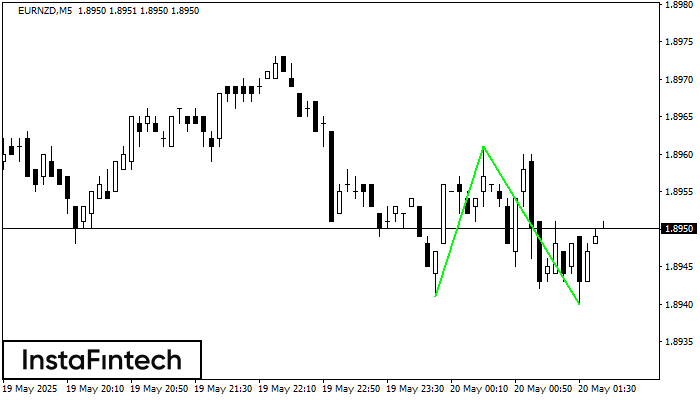
O padrão Fundo duplo foi formado em EURNZD M5; o limite superior é 1.8961; o limite inferior é 1.8940. A largura do padrão é de 20 pontos. No caso
Os intervalos M5 e M15 podem ter mais pontos de entrada falsos.
Open chart in a new window
Triângulo Simétrico de Alta
was formed on 20.05 at 00:43:21 (UTC+0)
signal strength 1 of 5
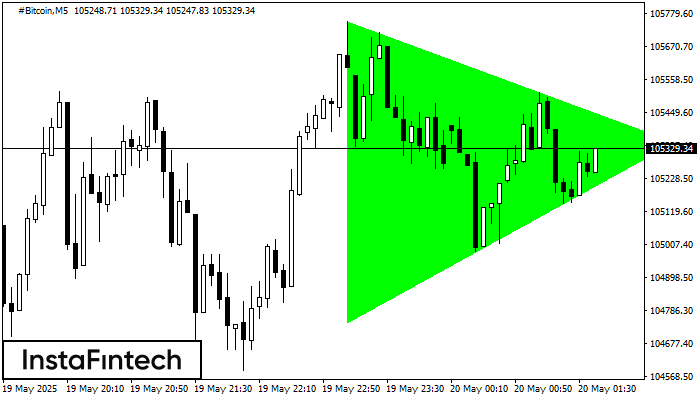
De acordo com o gráfico de M5, #Bitcoin formou o padrão de Triângulo Simétrico de Alta, sinalizando que a tendência continuará. Descrição: O limite superior do padrão toca as coordenadas
Os intervalos M5 e M15 podem ter mais pontos de entrada falsos.
Open chart in a new window
Fundo duplo
was formed on 20.05 at 00:30:27 (UTC+0)
signal strength 3 of 5
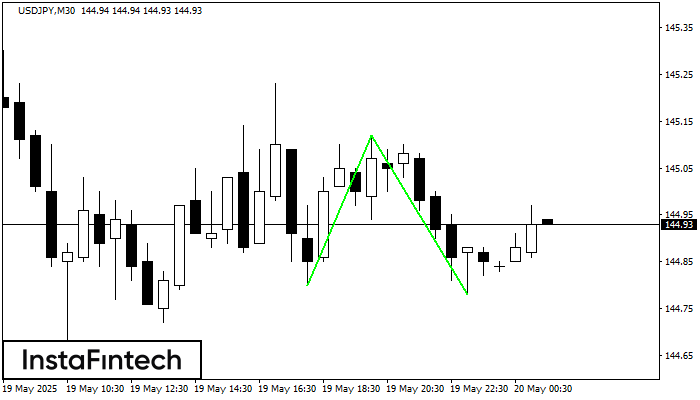
O padrão Fundo duplo foi formado em USDJPY M30; o limite superior é 145.12; o limite inferior é 144.78. A largura do padrão é de 32 pontos. No caso
Open chart in a new window


