

Padrões atuais

Padrões são modelos gráficos que são formados no gráfico pelo preço. Segundo um dos postulados da análise técnica, a história (movimento de preços) se repete. Isso significa que os movimentos de preços geralmente são semelhantes nas mesmas situações, o que possibilita prever o desenvolvimento futuro da situação com alta probabilidade.
Os padrões relevantes da InstaTrade são um serviço fácil de usar, que permite que você esteja ciente das últimas mudanças no mercado e reaja a indícios do mercado a tempo. Em nosso serviço, você sempre encontrará os padrões mais recentes e relevantes em qualquer par e em qualquer período gráfico.
Bullish Flag
was formed on 10.03 at 13:49:20 (UTC+0)
signal strength 3 of 5
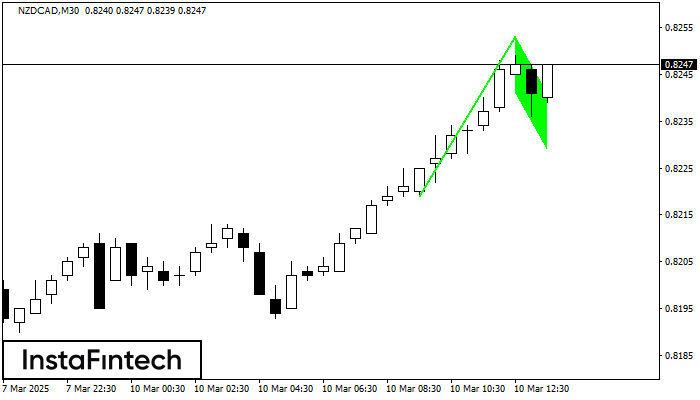
The Bullish Flag pattern has been formed on the chart NZDCAD M30 which signals that the upward trend will continue. Signals: а break of the peak at 0.8253 may push the price higher, and the rise will be the projection of the pole.
- All
- All
- Bearish Rectangle
- Bearish Symmetrical Triangle
- Bearish Symmetrical Triangle
- Bullish Rectangle
- Double Top
- Double Top
- Triple Bottom
- Triple Bottom
- Triple Top
- Triple Top
- All
- All
- Buy
- Sale
- All
- 1
- 2
- 3
- 4
- 5
Fundo duplo
was formed on 13.06 at 04:55:46 (UTC+0)
signal strength 1 of 5

O padrão Fundo duplo foi formado em GBPJPY M5; o limite superior é 194.31; o limite inferior é 193.76. A largura do padrão é de 58 pontos. No caso
Os intervalos M5 e M15 podem ter mais pontos de entrada falsos.
Open chart in a new window
Fundo duplo
was formed on 13.06 at 03:50:43 (UTC+0)
signal strength 1 of 5
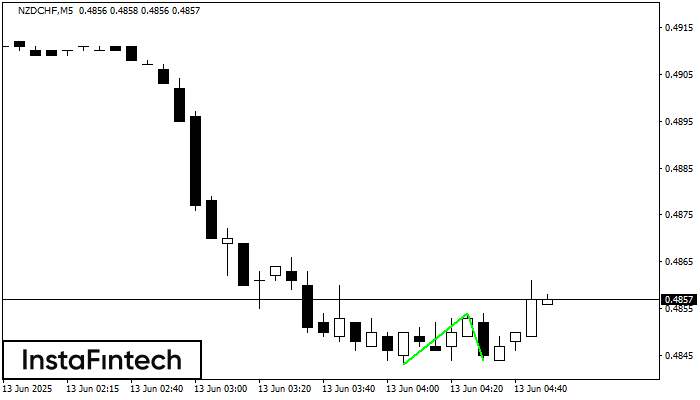
O padrão Fundo duplo foi formado em NZDCHF M5; o limite superior é 0.4854; o limite inferior é 0.4844. A largura do padrão é de 11 pontos. No caso
Os intervalos M5 e M15 podem ter mais pontos de entrada falsos.
Open chart in a new window
Pennant de baixa
was formed on 13.06 at 03:23:55 (UTC+0)
signal strength 1 of 5
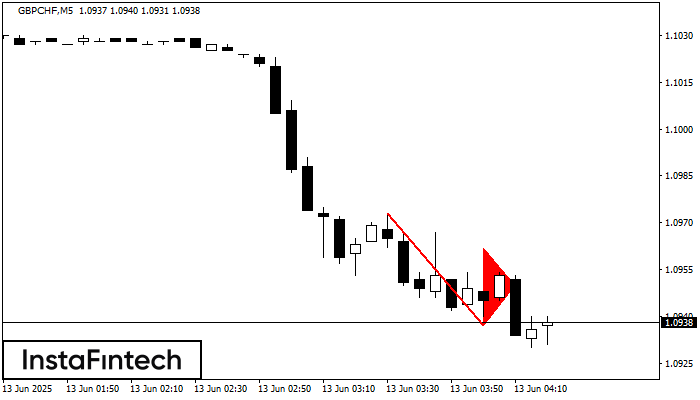
O padrão Pennant de baixa foi formado no gráfico GBPCHF M5. Este tipo de padrão é caracterizado por uma ligeira desaceleração após a qual o preço se moverá na direção
Os intervalos M5 e M15 podem ter mais pontos de entrada falsos.
Open chart in a new window


