Veja também


 11.07.2024 06:27 PM
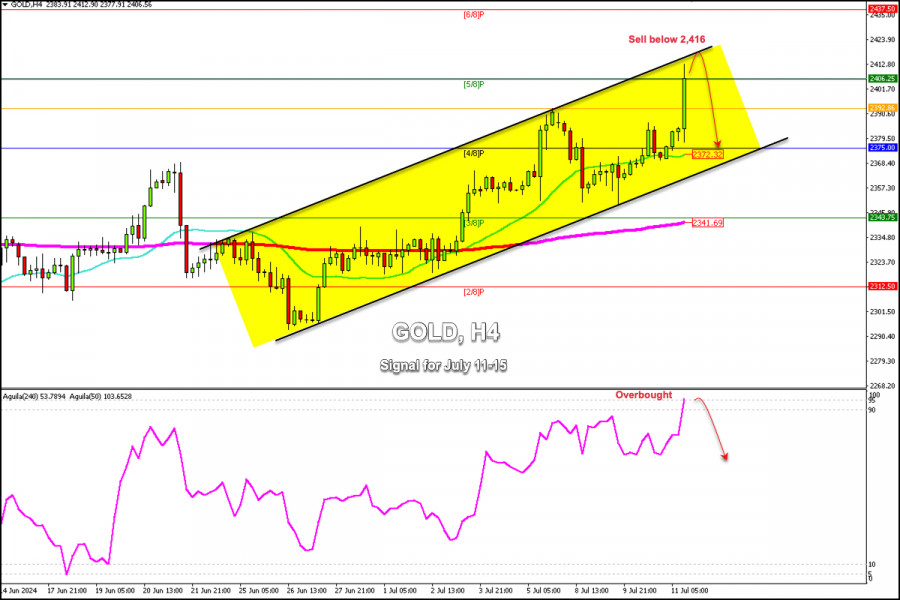
Early in the American session, gold is trading around the 2,405 level that coincides with the 5/8 Murray and within the uptrend channel forming since June 25.
Gold could make a technical correction in the next few hours since the eagle indicator reached the overbought zone. The metal also reached the top of the bullish trend channel which means strong bearish pressure below 2,317. So, we could expect a technical correction towards the psychological level of 2,400 which could even push the price up to 4/8 Murray at 2,475.
Yesterday in our analysis, we pointed out that gold had left the GAP at 2,391. Today after the inflation data from the United States, gold covered this GAP and surpassed that barrier reaching a high of 2,413. Therefore, we believe that a technical correction could occur only if the Gold settles below the top of the uptrend channel.
If gold consolidates below 2,417 – 2,422 in the next few hours, the outlook will be a technical correction and we could look for opportunities to sell below the top of the bullish trend channel or even below Murray's 6/8 with targets at 2,392 and 2,375.
On the other hand, if gold consolidates above 2,315, it is expected to reach 2,437 (6/8 Murray) in the next few days. This area means strong resistance and it is most likely that below that area, gold will have difficulties to continue rising.
Our trading plan for the next few hours is to sell gold at the current price levels with a target at 2,375. The eagle indicator is giving overbought signals which means a technical correction is imminent in the next few hours.
You have already liked this post today
*A análise de mercado aqui postada destina-se a aumentar o seu conhecimento, mas não dar instruções para fazer uma negociação.
Com base no gráfico de 4 horas, observa-se uma divergência entre o movimento de preços do AUD/JPY e o indicador Estocástico. Isso sugere potencial de enfraquecimento no curto prazo
Há alguns pontos interessantes no momento em relação ao USD/IDR. Primeiro, o movimento do preço está abaixo da média móvel ponderada de 21 períodos (WMA 21). Segundo, observamos a formação
O Bitcoin está sendo negociado próximo de 110.726, passando por uma correção técnica após atingir 110.726, um nível observado no final de maio. O Bitcoin formou um padrão de topo
Se o ouro romper o canal de tendência de baixa e se consolidar acima de 3.340, a perspectiva pode ser de alta. O metal poderia então atingir 3.359, 3.390
Com o surgimento do padrão Cunha Ascendente Expandida, seguido pela formação do padrão 123 de baixa, há uma indicação de que o EUR/USD tem potencial para se enfraquecer
No gráfico de 4 horas do par cruzado GBP/JPY, é possível observar alguns aspectos interessantes. Em primeiro lugar, o movimento de preço permanece acima da média móvel ponderada
No início da sessão americana, o ouro está sendo negociado perto de 3.317, recuperando-se depois de atingir uma baixa de 3.294 durante a sessão europeia. No gráfico 4H, o ouro
Acreditamos que o euro possa continuar a cair, já que um padrão de continuação de baixa está se formando, mas devemos esperar que ele caia abaixo de 1,1400, podendo então
Your IP address shows that you are currently located in the USA. If you are a resident of the United States, you are prohibited from using the services of InstaFintech Group including online trading, online transfers, deposit/withdrawal of funds, etc.
If you think you are seeing this message by mistake and your location is not the US, kindly proceed to the website. Otherwise, you must leave the website in order to comply with government restrictions.
Why does your IP address show your location as the USA?
Please confirm whether you are a US resident or not by clicking the relevant button below. If you choose the wrong option, being a US resident, you will not be able to open an account with InstaTrade anyway.
We are sorry for any inconvenience caused by this message.

