Veja também


 10.04.2023 06:41 AM
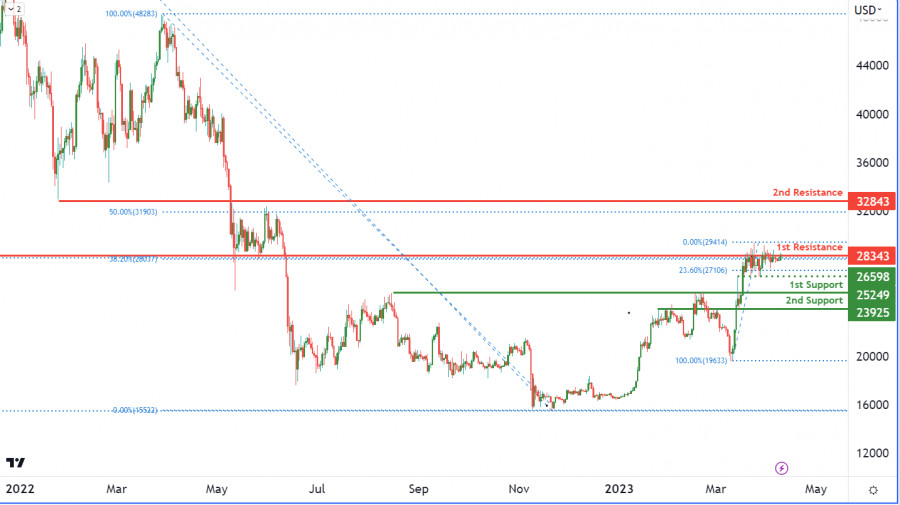
The BTC/USD chart currently reflects a bearish momentum in the cryptocurrency market, and Bitcoin seems to be following the trend. The chart suggests that the price of Bitcoin could face resistance at the 1st resistance level of 28343, which has previously been an important level as an overlap resistance. If Bitcoin fails to break through this level, it may result in a bearish reaction causing the price to drop towards the 1st support level of 25249. This level, being a pullback support, could act as a strong support for the price of Bitcoin.
In the event that the price of Bitcoin breaks through the 1st resistance level, the next resistance level it could face is the 2nd resistance level of 32843, which is a pullback resistance. Conversely, if Bitcoin breaks below the 1st support level, the next support level it could drop to is the 2nd support level of 23925. This level, also being a pullback support, could potentially act as a strong support for the price of Bitcoin.
Additionally, there is an intermediate support level at 26598, which is a swing low support and is accompanied by a 23.60% Fibonacci retracement. This level could potentially provide support to the price of Bitcoin if it drops towards the 1st support level. Overall, the BTC/USD chart's momentum is bearish, indicating that the price is expected to continue falling in the near term.
You have already liked this post today
*A análise de mercado aqui postada destina-se a aumentar o seu conhecimento, mas não dar instruções para fazer uma negociação.
Se observarmos o gráfico diário do Petróleo Bruto (#CL), é possível identificar uma divergência entre o movimento dos preços do ativo e o indicador Estocástico. Isso sugere a possibilidade
No gráfico de 4 horas do índice Nasdaq 100, podemos observar uma divergência entre o movimento dos preços e o indicador Estocástico, especialmente com a confirmação atual
Se o preço do euro cair abaixo de 1,1500 nas próximas horas, isso pode ser visto como uma oportunidade de venda. Tecnicamente, ele parece estar sobrecomprado no gráfico
A tendência do XAU/USD permanece de alta enquanto o preço se consolidar acima de 3.331. Portanto, seria prudente comprar ouro enquanto o preço se consolidar acima de 3.359, onde está
Notificações por
E-mail/SMS

Your IP address shows that you are currently located in the USA. If you are a resident of the United States, you are prohibited from using the services of InstaFintech Group including online trading, online transfers, deposit/withdrawal of funds, etc.
If you think you are seeing this message by mistake and your location is not the US, kindly proceed to the website. Otherwise, you must leave the website in order to comply with government restrictions.
Why does your IP address show your location as the USA?
Please confirm whether you are a US resident or not by clicking the relevant button below. If you choose the wrong option, being a US resident, you will not be able to open an account with InstaTrade anyway.
We are sorry for any inconvenience caused by this message.

