Veja também


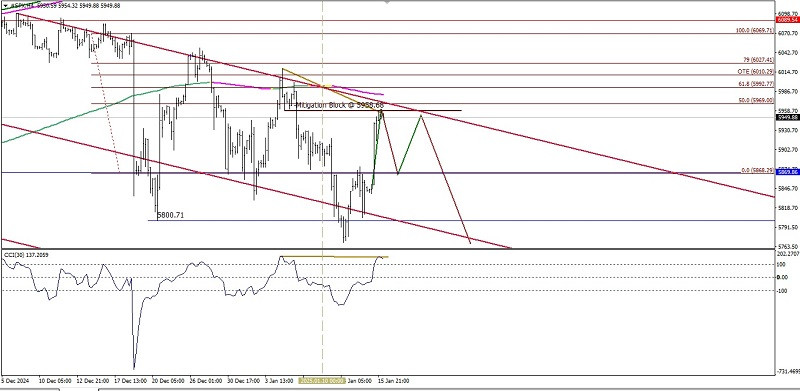
If we look at the 4-hour chart of the S&P 500 index, it can be seen that this index is moving in a weakening downward condition, which is confirmed by its current price movement moving harmoniously in the bearish Pitchfork channel which has a decreasing slope and its price movement is below the MA (200) which has a decreasing slope downwards, especially with the appearance of Double Top in the CCI (30) indicator, while its price movement actually forms a Higher-Low convergence, then confirmation in the near future that #SPX will experience a weakening even though there is a potential for a strengthening retracement as long as it does not break through and close above the 6010.29 level, then SPX has the potential to weaken again and will test the 5868.29 level as its main target and if the momentum of the weakening and its volatility support it, then #SPX will head to 5800.71 and/or the middle level of its Pitchfork channel.
(Disclaimer)
You have already liked this post today
*A análise de mercado aqui postada destina-se a aumentar o seu conhecimento, mas não dar instruções para fazer uma negociação.


