

Actual patterns

Patterns are graphical models which are formed in the chart by the price. According to one of the technical analysis postulates, history (price movement) repeats itself. It means that the price movements are often similar in the same situations which makes it possible to predict the further development of the situation with a high probability.
Relevant patterns by InstaTrade is an easy-to-use service which allows you to be aware of latest changes in the market and react to clues from the market in time. In our service you will always find the latest and most relevant patterns on any pair and any timeframe.
Bearish Rectangle
was formed on 14.04 at 16:42:50 (UTC+0)
signal strength 1 of 5
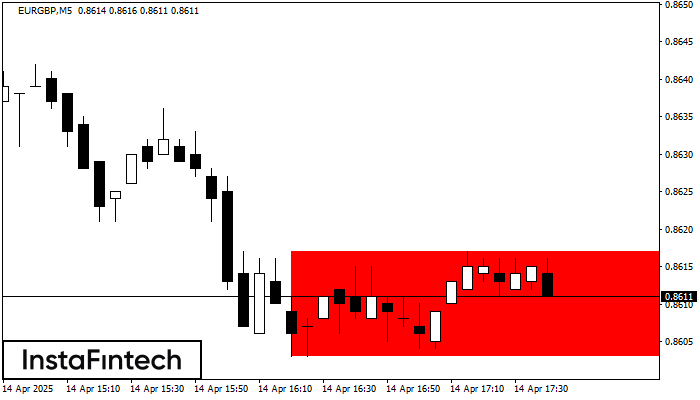
According to the chart of M5, EURGBP formed the Bearish Rectangle. The pattern indicates a trend continuation. The upper border is 0.8617, the lower border is 0.8603. The signal means that a short position should be opened after fixing a price below the lower border 0.8603 of the Bearish Rectangle.
The M5 and M15 time frames may have more false entry points.
- All
- All
- Bearish Rectangle
- Bearish Symmetrical Triangle
- Bearish Symmetrical Triangle
- Bullish Rectangle
- Double Top
- Double Top
- Triple Bottom
- Triple Bottom
- Triple Top
- Triple Top
- All
- All
- Buy
- Sale
- All
- 1
- 2
- 3
- 4
- 5
Topo duplo
was formed on 22.05 at 09:30:18 (UTC+0)
signal strength 3 of 5
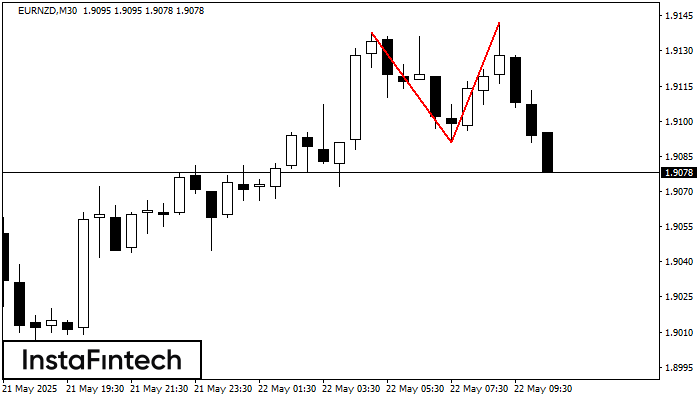
No gráfico de EURNZD M30 o padrão de reversão Topo duplo foi formado. Características: o limite superior 1.9142; o limite inferior 1.9091; a largura do padrão 51 pontos. O sinal
Open chart in a new window
Triângulo Simétrico de Alta
was formed on 22.05 at 08:01:53 (UTC+0)
signal strength 3 of 5

De acordo com o gráfico de M30, EURUSD formou o padrão de Triângulo Simétrico de Alta, sinalizando que a tendência continuará. Descrição: O limite superior do padrão toca as coordenadas
Open chart in a new window
Pennant de baixa
was formed on 22.05 at 08:00:35 (UTC+0)
signal strength 4 of 5

O padrão Pennant de baixa foi formado no gráfico NZDCAD H1. O padrão sinaliza a continuação da tendência de baixa caso o pennant de baixa de 0.8197 for quebrada. Recomendações
Open chart in a new window


