

Actual patterns

Patterns are graphical models which are formed in the chart by the price. According to one of the technical analysis postulates, history (price movement) repeats itself. It means that the price movements are often similar in the same situations which makes it possible to predict the further development of the situation with a high probability.
Relevant patterns by InstaTrade is an easy-to-use service which allows you to be aware of latest changes in the market and react to clues from the market in time. In our service you will always find the latest and most relevant patterns on any pair and any timeframe.
Bullish Flag
was formed on 08.04 at 06:40:26 (UTC+0)
signal strength 1 of 5
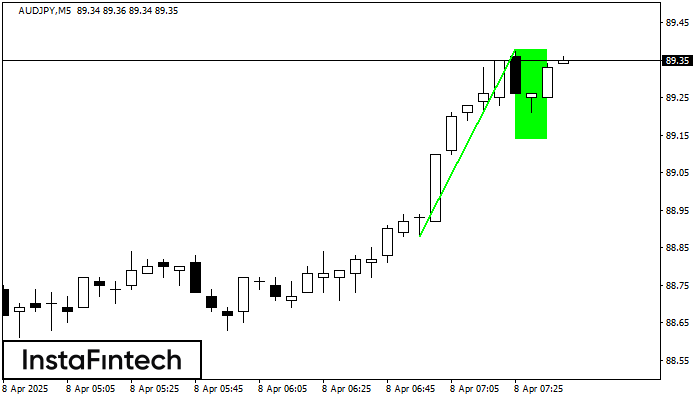
The Bullish Flag pattern has been formed on AUDJPY at M5. The lower boundary of the pattern is located at 89.14/89.14, while the higher boundary lies at 89.38/89.38. The projection of the flagpole is 50 points. This formation signals that the upward trend is most likely to continue. Therefore, if the level of 89.38 is broken, the price will move further upwards.
The M5 and M15 time frames may have more false entry points.
- All
- All
- Bearish Rectangle
- Bearish Symmetrical Triangle
- Bearish Symmetrical Triangle
- Bullish Rectangle
- Double Top
- Double Top
- Triple Bottom
- Triple Bottom
- Triple Top
- Triple Top
- All
- All
- Buy
- Sale
- All
- 1
- 2
- 3
- 4
- 5
Fundo duplo
was formed on 15.05 at 18:00:02 (UTC+0)
signal strength 2 of 5
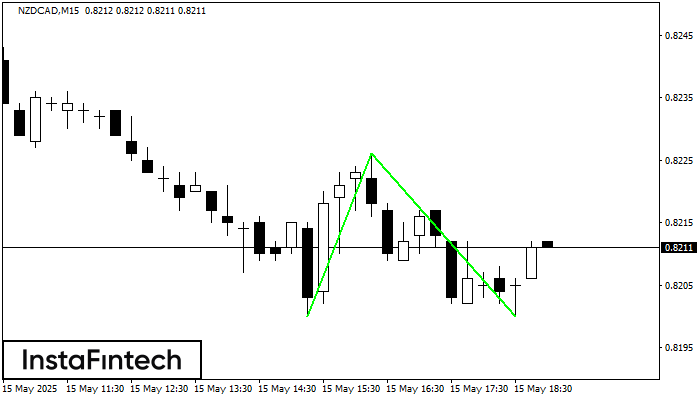
O padrão Fundo duplo foi formado em NZDCAD M15. Esta formação sinaliza uma reversão da tendência de baixo para cima. O sinal é que uma negociação de compra deve
Os intervalos M5 e M15 podem ter mais pontos de entrada falsos.
Open chart in a new window
Topo duplo
was formed on 15.05 at 17:59:42 (UTC+0)
signal strength 1 of 5
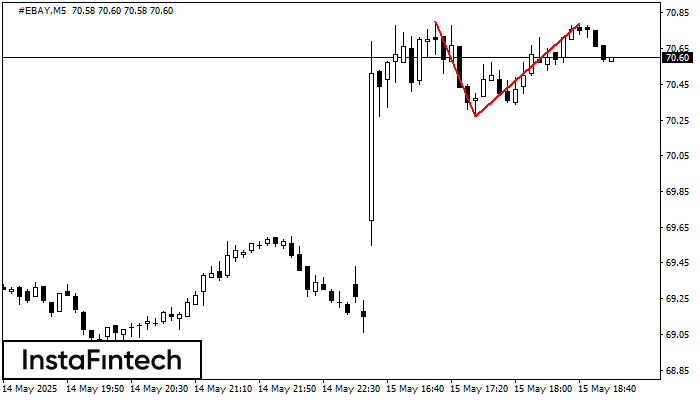
O padrão Topo duplo foi formado em #EBAY M5. Isso sinaliza que a tendência foi alterada de cima para baixo. Provavelmente, se a base do padrão 70.27 for quebrada
Os intervalos M5 e M15 podem ter mais pontos de entrada falsos.
Open chart in a new window
Fundo duplo
was formed on 15.05 at 17:50:00 (UTC+0)
signal strength 1 of 5
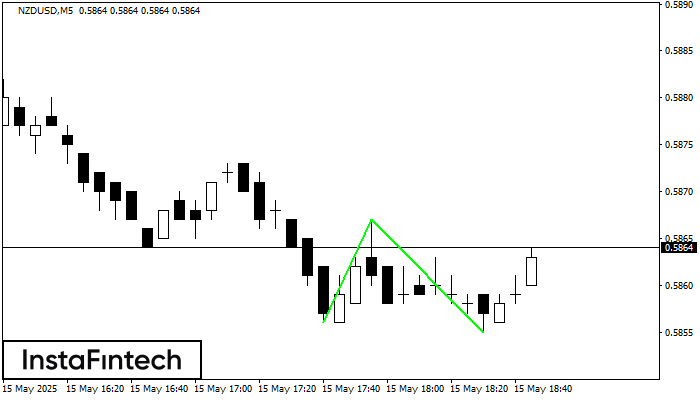
O padrão Fundo duplo foi formado em NZDUSD M5; o limite superior é 0.5867; o limite inferior é 0.5855. A largura do padrão é de 11 pontos. No caso
Os intervalos M5 e M15 podem ter mais pontos de entrada falsos.
Open chart in a new window


