

اصل پیٹرن یعنی ایکچوئل پیٹرن

پیٹرن تصویری صورت یعنی گرافکل ماڈلز ہوتے ہیں جو کہ چارٹ میں قیمت کی جانب سے بنتے ہیں جو کہ ٹیکنیکل تجزیات کے امکانات ، ہسٹری {قیمت کے اتار چڑھاو} چونکہ قیمت اپنے آپ کو دہراتی ہے - جس کا مطلب یہ ہے کہ قیمت کا اتار چڑھا یعنی حرکت ایک جیسے حالات میں ہی عموما مختلف ہوتی ہے جو کہ اس بات کو ممکن بناتی ہے قیمت کے مزید رویہ کی پیشن گوئی کی جاسکے جس کا اُسی طرح ہونے کے امکانات خاصے واضح ہوتے ہیں
انسٹا فاریکس کی "ریلی وینٹ" پیٹرنز نامی سروس استعمال میں بہت ہی آسان ہے جو کہ آپ کو مارکیٹ میں ہونے والی تازہ ترین تبدیلیوں کے حوالے باخبر رکھتے ہیں اور مارکیٹ کے ملنے والے اشاروں پر بر وقت در عمل دینے کے قابل کرتے ہیں - ہماری سہولیات سے آپ ہمیشہ پائیں گے تازہ ترین اور سب سے ذیادہ کار آمد انداز یعنی ریلی وینٹ انداز دستیاب ہوں گے- جو کہ کسی بھی پئیر اور ٹائم فریم کے حوالے سے دستیاب ہوں گے
Bearish pennant
was formed on 04.04 at 17:33:22 (UTC+0)
signal strength 2 of 5
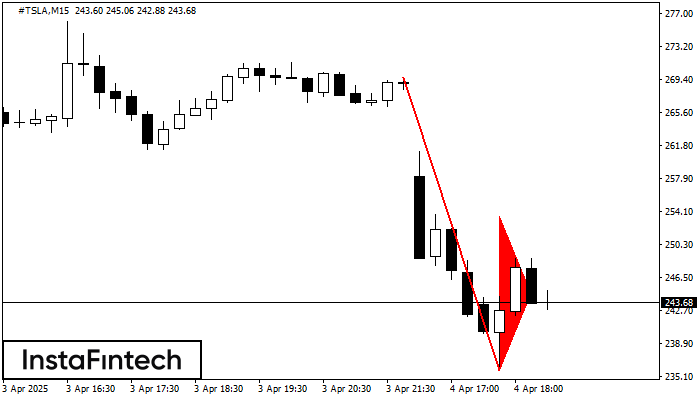
The Bearish pennant pattern has formed on the #TSLA M15 chart. This pattern type is characterized by a slight slowdown after which the price will move in the direction of the original trend. In case the price fixes below the pattern’s low of 235.81, a trader will be able to successfully enter the sell position.
The M5 and M15 time frames may have more false entry points.
- All
- All
- Bearish Rectangle
- Bearish Symmetrical Triangle
- Bearish Symmetrical Triangle
- Bullish Rectangle
- Double Top
- Double Top
- Triple Bottom
- Triple Bottom
- Triple Top
- Triple Top
- All
- All
- Buy
- Sale
- All
- 1
- 2
- 3
- 4
- 5
Segi Tiga Simetri Menurun
was formed on 07.05 at 02:30:44 (UTC+0)
signal strength 2 of 5
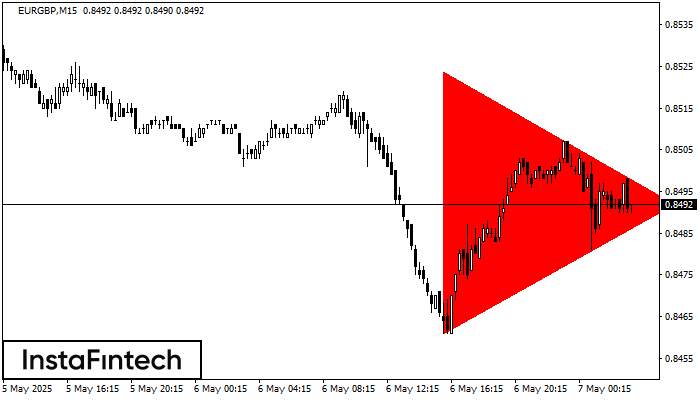
Berdasarkan carta M15, EURGBP membentuk corak Segi Tiga Simetri Menurun. Cadangan dagangan: Penembusan sempadan bawah 0.8461 mungkin mendorong kepada kesinambungan aliran menurun
Carta masa M5 dan M15 mungkin mempunyai lebih banyak titik kemasukan palsu.
Open chart in a new window
Double Bottom
was formed on 07.05 at 01:00:48 (UTC+0)
signal strength 4 of 5
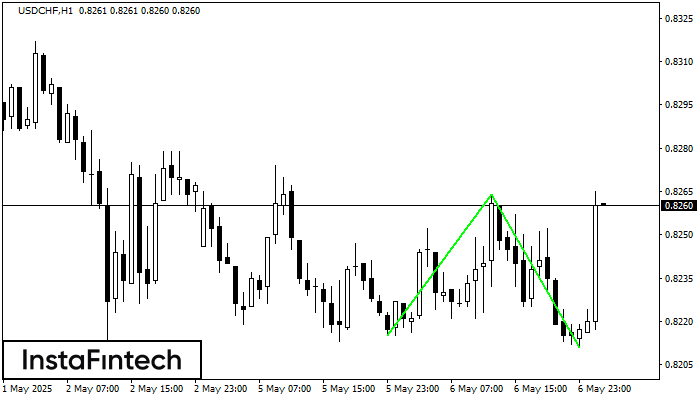
Corak Double Bottom telah dibentuk pada USDCHF H1; sempadan atas adalah 0.8264; sempadan bawah adalah 0.8211. Lebar corak adalah 49 mata. Sekiranya penembusan sempadan atas 0.8264, perubahan aliran boleh diramalkan
Open chart in a new window
Double Bottom
was formed on 07.05 at 01:00:39 (UTC+0)
signal strength 4 of 5
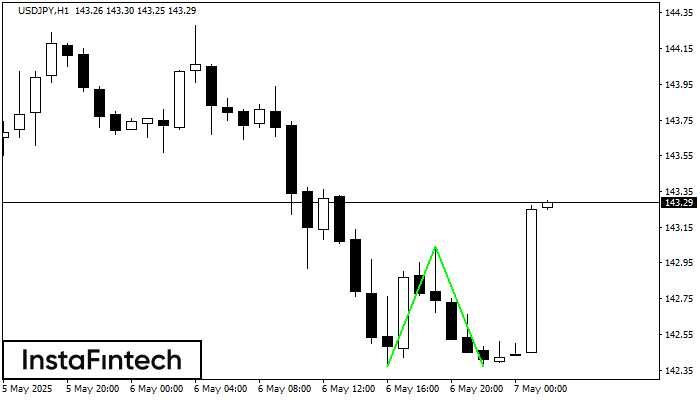
Corak Double Bottom telah dibentuk pada USDJPY H1. Ciri-ciri: tahap sokongan 142.37; tahap rintangan 143.04; lebar corak 67 mata. Sekiranya tahap rintangan ditembusi, perubahan aliran boleh diramalkan dengan titik sasaran
Open chart in a new window


