

اصل پیٹرن یعنی ایکچوئل پیٹرن

پیٹرن تصویری صورت یعنی گرافکل ماڈلز ہوتے ہیں جو کہ چارٹ میں قیمت کی جانب سے بنتے ہیں جو کہ ٹیکنیکل تجزیات کے امکانات ، ہسٹری {قیمت کے اتار چڑھاو} چونکہ قیمت اپنے آپ کو دہراتی ہے - جس کا مطلب یہ ہے کہ قیمت کا اتار چڑھا یعنی حرکت ایک جیسے حالات میں ہی عموما مختلف ہوتی ہے جو کہ اس بات کو ممکن بناتی ہے قیمت کے مزید رویہ کی پیشن گوئی کی جاسکے جس کا اُسی طرح ہونے کے امکانات خاصے واضح ہوتے ہیں
انسٹا فاریکس کی "ریلی وینٹ" پیٹرنز نامی سروس استعمال میں بہت ہی آسان ہے جو کہ آپ کو مارکیٹ میں ہونے والی تازہ ترین تبدیلیوں کے حوالے باخبر رکھتے ہیں اور مارکیٹ کے ملنے والے اشاروں پر بر وقت در عمل دینے کے قابل کرتے ہیں - ہماری سہولیات سے آپ ہمیشہ پائیں گے تازہ ترین اور سب سے ذیادہ کار آمد انداز یعنی ریلی وینٹ انداز دستیاب ہوں گے- جو کہ کسی بھی پئیر اور ٹائم فریم کے حوالے سے دستیاب ہوں گے
Bearish Flag
was formed on 04.04 at 03:26:08 (UTC+0)
signal strength 1 of 5

The Bearish Flag pattern has been formed on the chart AUDCAD M5 which signals that the downward trend will continue. If the price breaks below the low at 0.8881, then it is most likely to move further downwards. The price will likely move by the number of points which equals the length of the flag pole (10 points).
The M5 and M15 time frames may have more false entry points.
- All
- All
- Bearish Rectangle
- Bearish Symmetrical Triangle
- Bearish Symmetrical Triangle
- Bullish Rectangle
- Double Top
- Double Top
- Triple Bottom
- Triple Bottom
- Triple Top
- Triple Top
- All
- All
- Buy
- Sale
- All
- 1
- 2
- 3
- 4
- 5
Triple Bottom
was formed on 05.05 at 21:40:10 (UTC+0)
signal strength 1 of 5
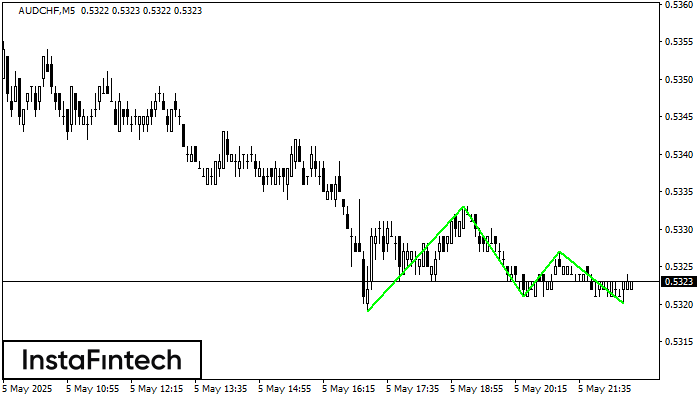
The Triple Bottom pattern has formed on the chart of AUDCHF M5. Features of the pattern: The lower line of the pattern has coordinates 0.5333 with the upper limit 0.5333/0.5327
The M5 and M15 time frames may have more false entry points.
Open chart in a new window
Double Top
was formed on 05.05 at 21:30:11 (UTC+0)
signal strength 1 of 5
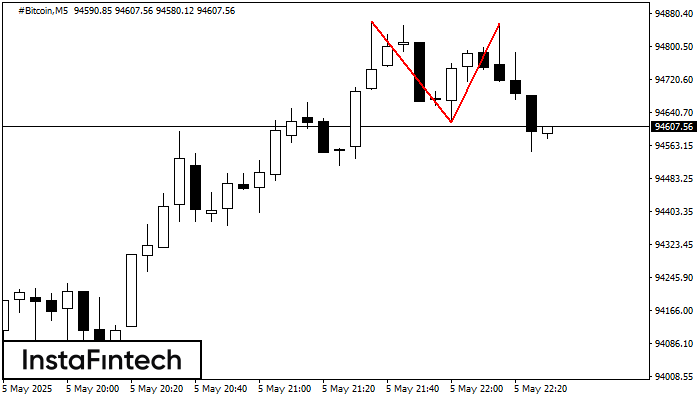
The Double Top reversal pattern has been formed on #Bitcoin M5. Characteristics: the upper boundary 94860.22; the lower boundary 94618.10; the width of the pattern is 23764 points. Sell trades
The M5 and M15 time frames may have more false entry points.
Open chart in a new window
Double Bottom
was formed on 05.05 at 21:15:11 (UTC+0)
signal strength 2 of 5
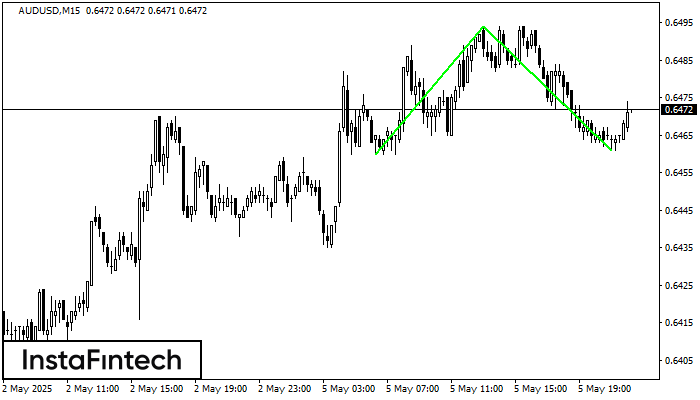
The Double Bottom pattern has been formed on AUDUSD M15; the upper boundary is 0.6494; the lower boundary is 0.6461. The width of the pattern is 34 points. In case
The M5 and M15 time frames may have more false entry points.
Open chart in a new window


