

اصل پیٹرن یعنی ایکچوئل پیٹرن

پیٹرن تصویری صورت یعنی گرافکل ماڈلز ہوتے ہیں جو کہ چارٹ میں قیمت کی جانب سے بنتے ہیں جو کہ ٹیکنیکل تجزیات کے امکانات ، ہسٹری {قیمت کے اتار چڑھاو} چونکہ قیمت اپنے آپ کو دہراتی ہے - جس کا مطلب یہ ہے کہ قیمت کا اتار چڑھا یعنی حرکت ایک جیسے حالات میں ہی عموما مختلف ہوتی ہے جو کہ اس بات کو ممکن بناتی ہے قیمت کے مزید رویہ کی پیشن گوئی کی جاسکے جس کا اُسی طرح ہونے کے امکانات خاصے واضح ہوتے ہیں
انسٹا فاریکس کی "ریلی وینٹ" پیٹرنز نامی سروس استعمال میں بہت ہی آسان ہے جو کہ آپ کو مارکیٹ میں ہونے والی تازہ ترین تبدیلیوں کے حوالے باخبر رکھتے ہیں اور مارکیٹ کے ملنے والے اشاروں پر بر وقت در عمل دینے کے قابل کرتے ہیں - ہماری سہولیات سے آپ ہمیشہ پائیں گے تازہ ترین اور سب سے ذیادہ کار آمد انداز یعنی ریلی وینٹ انداز دستیاب ہوں گے- جو کہ کسی بھی پئیر اور ٹائم فریم کے حوالے سے دستیاب ہوں گے
Bearish Symmetrical Triangle
was formed on 28.03 at 21:30:39 (UTC+0)
signal strength 2 of 5
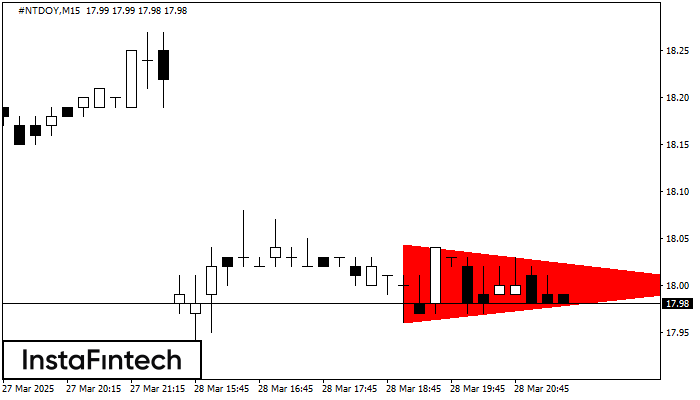
According to the chart of M15, #NTDOY formed the Bearish Symmetrical Triangle pattern. Description: The lower border is 17.96/18.00 and upper border is 18.04/18.00. The pattern width is measured on the chart at -8 pips. The formation of the Bearish Symmetrical Triangle pattern evidently signals a continuation of the downward trend. In other words, if the scenario comes true and #NTDOY breaches the lower border, the price could continue its move toward 17.77.
The M5 and M15 time frames may have more false entry points.
یہ بھی دیکھیں
- All
- All
- Bearish Rectangle
- Bearish Symmetrical Triangle
- Bearish Symmetrical Triangle
- Bullish Rectangle
- Double Top
- Double Top
- Triple Bottom
- Triple Bottom
- Triple Top
- Triple Top
- All
- All
- Buy
- Sale
- All
- 1
- 2
- 3
- 4
- 5
Bawah Ganda
was formed on 05.05 at 13:00:02 (UTC+0)
signal strength 2 of 5
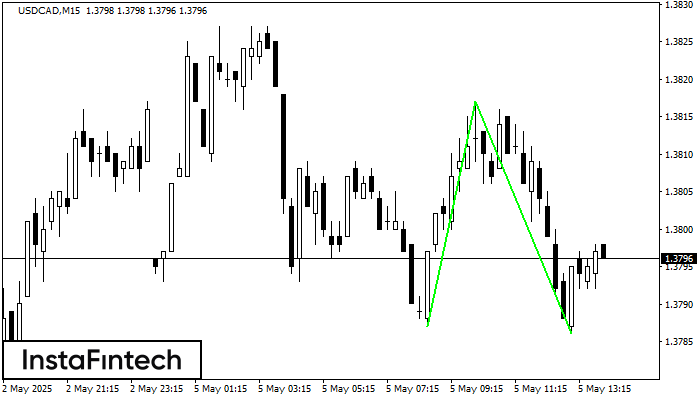
Pola Bawah Ganda telah terbentuk pada USDCAD M15; batas atas di 1.3817; batas bawah di 1.3786. Lebar pola sebesar 30 poin. Jika harga menembus batas atas 1.3817, Perubahan dalam tren
Rangka waktu M5 dan M15 mungkin memiliki lebih dari titik entri yang keliru.
Open chart in a new window
Bawah Ganda
was formed on 05.05 at 12:20:14 (UTC+0)
signal strength 1 of 5
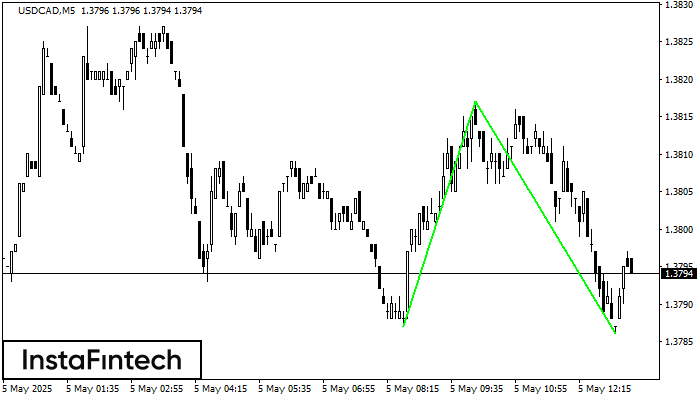
Pola Bawah Ganda telah terbentuk pada USDCAD M5; batas atas di 1.3817; batas bawah di 1.3786. Lebar pola sebesar 30 poin. Jika harga menembus batas atas 1.3817, Perubahan dalam tren
Rangka waktu M5 dan M15 mungkin memiliki lebih dari titik entri yang keliru.
Open chart in a new window
Teratas Ganda
was formed on 05.05 at 12:19:52 (UTC+0)
signal strength 1 of 5
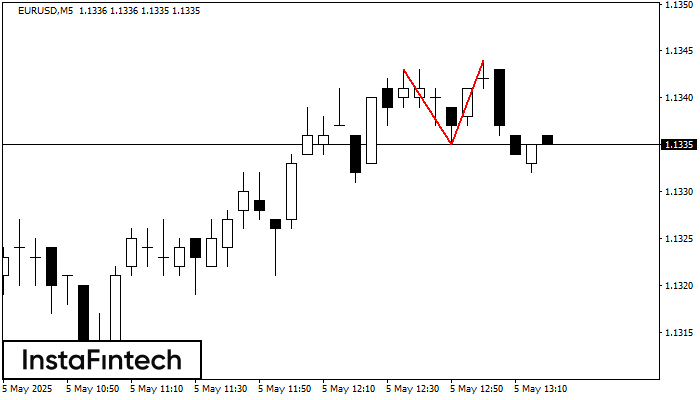
Pada grafik EURUSD M5 pola reversal Teratas Ganda telah terbentuk. Karakteristik: batas atas 1.1344; batas bawah 1.1335; lebar pola 9 poin. Sinyal: tembusan ke batas bawah akan menyebabkan kelanjutan tren
Rangka waktu M5 dan M15 mungkin memiliki lebih dari titik entri yang keliru.
Open chart in a new window


