یہ بھی دیکھیں


 13.05.2024 12:55 PM
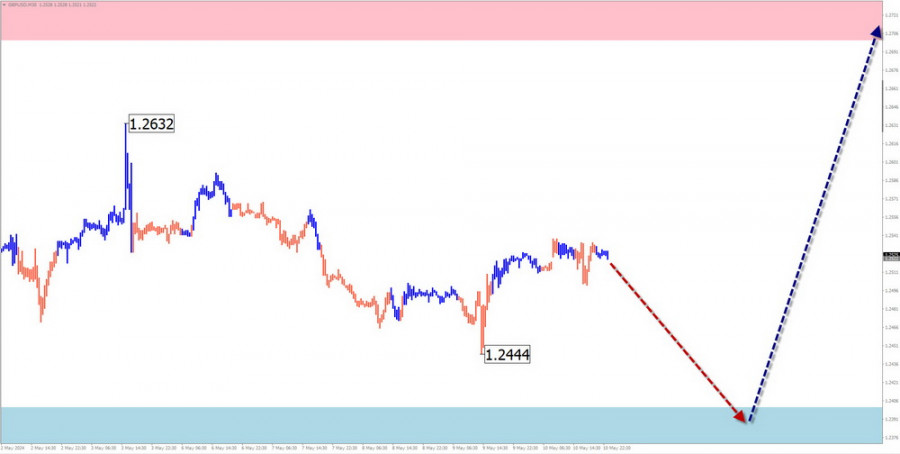
GBP/USD
Analysis:
The British pound in its main pair continues the downtrend that began last July. Extremes in the wave structure form a horizontal pennant. Over the last month, prices have been moving sideways, forming an intermediate correction of the last trend segment.
Forecast:
The upcoming week is expected to continue the overall sideways movement of the British currency. After a likely decline and pressure on the support zone in the second half of the week, a reversal in direction and the beginning of an uptrend can be expected. The resistance zone demonstrates the maximum expected range of the weekly movement of the pair.
Potential Reversal Zones
Resistance:
Support:
Recommendations:
Selling: Possible with a small volume within intraday trading.
Buying: No conditions for transactions until reversal signals appear in the support zone.
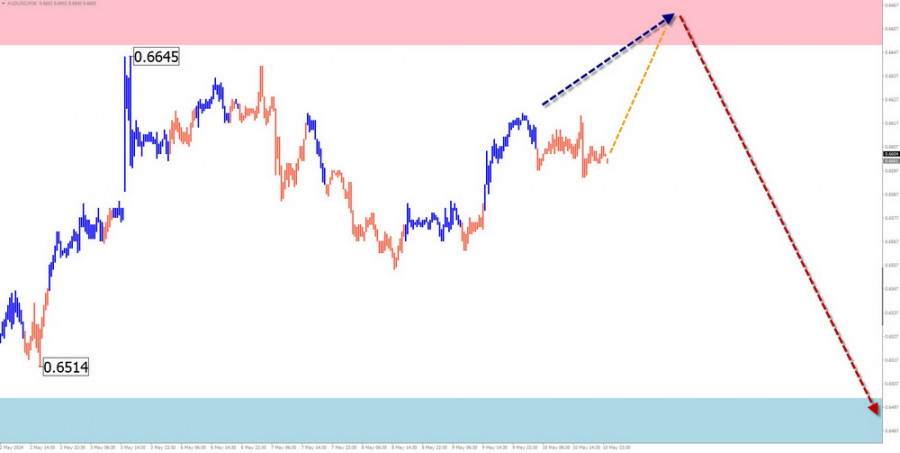
AUD/USD
Analysis:
A descending wave pattern has been forming on a large-scale chart of the Australian dollar since last summer. The unfinished upward segment started at the end of last December. Since April 19th, a corrective movement has been developing. The structure of this movement does not indicate completion.
Forecast:
In the upcoming weekly period, the overall sideways trend of price movement is expected to continue. A reversal and resumption of price decline are expected after a probable attempt to pressure the resistance zone in the coming days. The highest activity is likely towards the end of the week.
Potential Reversal Zones
Resistance:
Support:
Recommendations:
Buying: Possible in the coming days with a reduced volume within individual trading sessions. The resistance zone limits the potential.
Selling: Premature until confirmed reversal signals appear.
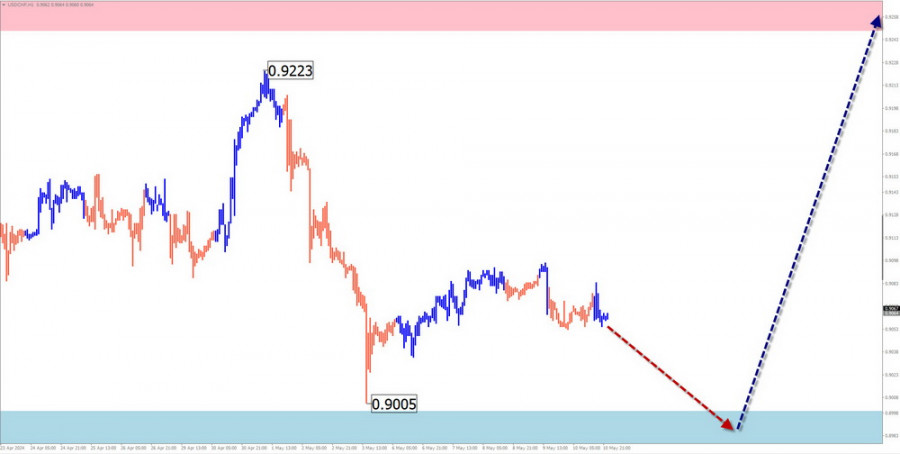
USD/CHF
Analysis:
The upward trend of the main Swiss franc pair since last December has brought quotes to the upper boundary of a strong potential reversal zone. The wave structure appears completed by now, but there are no signs of a change in direction on the chart.
Forecast:
Next week, the overall sideways movement is expected to continue. A decline and sideways movement along the support zone are possible in the first half. A brief breach of the lower boundary of the zone is not excluded. A reversal and resumption of price growth against increased volatility is likely closer to the weekend.
Potential Reversal Zones
Resistance:
Support:
Recommendations:
Buying: This can be used in trading after confirmed reversal signals appear in the support zone.
Selling: This has limited potential and may lead to losses.
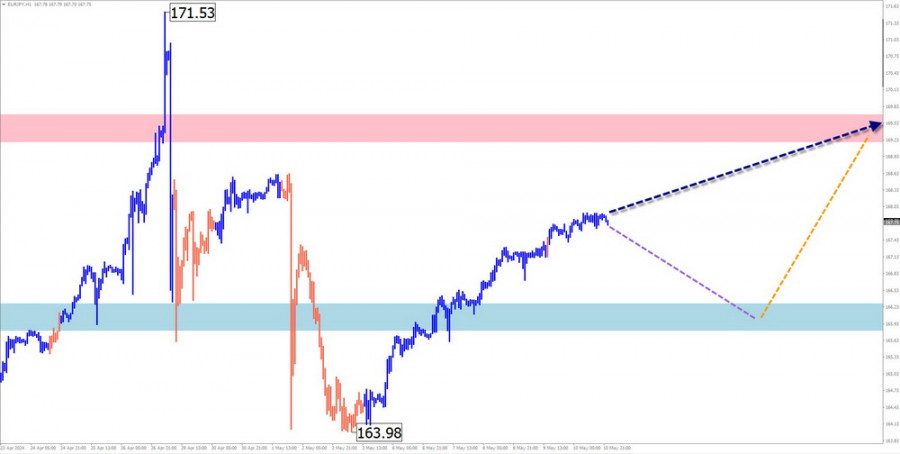
EUR/JPY
Analysis:
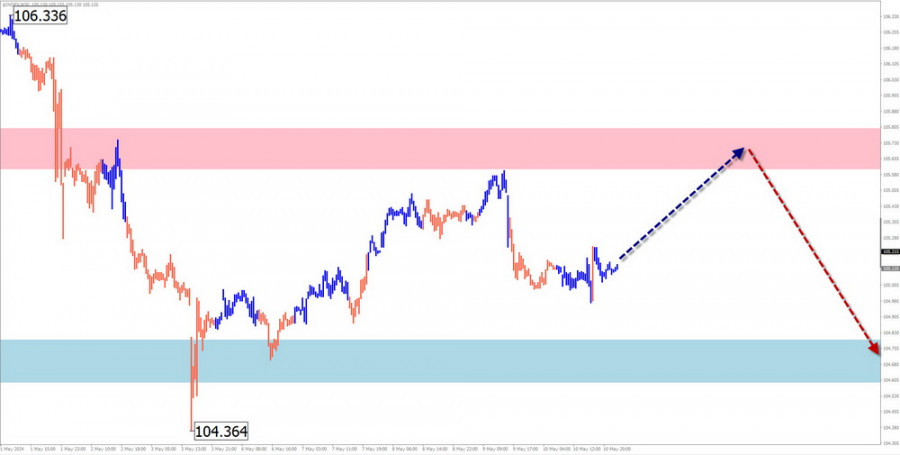
The upward trend continues to dominate the euro/Japanese yen pair chart. The unfinished segment along the main course started at the end of last year. The strong resistance level of the daily scale in April turned into support. Over the last month, the pair's price has been consolidating, forming an incomplete corrective segment.
Forecast:
A sideways movement is expected at the beginning of the upcoming week, with a probable decline towards the support zone. The second half of the week is expected to be more volatile. After possible pressure on support, there is a high probability of a change in direction and a resumption of price growth.
Potential Reversal Zones
Resistance:
Support:
Recommendations:
Selling: High risk. Fractional volumes can be used within individual sessions.
Buying: Possible after confirmed reversal signals appear in the support zone.
EUR/GBP
Analysis:
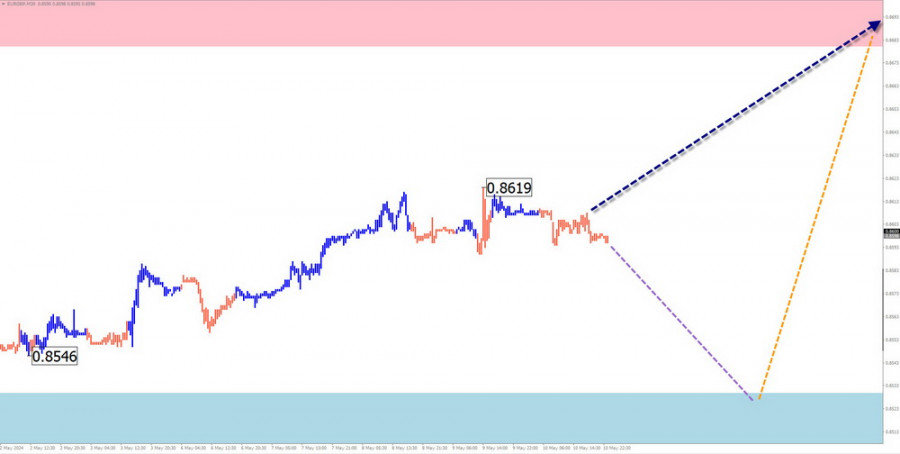
The formation of a descending plane continues on the euro/British pound pair chart. The unfinished segment started at the end of last year. The lower boundary of the price channel coincides with the daily support level. The pair's price has been moving along this level in recent months.
Forecast:
A sideways movement along the support zone can be expected at the beginning of the upcoming week. The second half of the week is expected to be more volatile. After possible pressure on support, there is a high probability of a change in direction and a resumption of price growth.
Potential Reversal Zones
Resistance:
Support:
Recommendations:
Selling: Potential is limited by support. Trade with the smallest volume possible.
Buying: Possible after confirmed reversal signals appear in the support zone.
US dollar index
Analysis:
The dominant direction of the US dollar quotes since last December is set by an ascending wave algorithm. After a recontact with the lower boundary of the weekly reversal zone, the quotes form a counter rollback. Its wave level is currently insufficient to change the direction of the wave.
Forecast:
In the next couple of days, a development of the ascending movement of the index is possible. Near the calculated resistance boundaries, a cessation of growth and a reversal formation can be expected. Renewed decline is likely towards the end of the week. The release of important news data may coincide with the timing of the reversal.
Potential Reversal Zones
Resistance:
Support:
Recommendations:
Weakness in national currencies in major pairs is nearing completion.
Strengthening national currencies may become the main direction for trading in the coming week.
Explanation: In simplified wave analysis (SWA), all waves consist of 3 parts (A-B-C). The last unfinished wave is analyzed at each timeframe. Dashed lines indicate expected movements.
Note: The wave algorithm does not consider the duration of instrument movements over time!
You have already liked this post today
*تعینات کیا مراد ہے مارکیٹ کے تجزیات یہاں ارسال کیے جاتے ہیں جس کا مقصد آپ کی بیداری بڑھانا ہے، لیکن تجارت کرنے کے لئے ہدایات دینا نہیں.
ای میل / ایس ایم ایس

Your IP address shows that you are currently located in the USA. If you are a resident of the United States, you are prohibited from using the services of InstaFintech Group including online trading, online transfers, deposit/withdrawal of funds, etc.
If you think you are seeing this message by mistake and your location is not the US, kindly proceed to the website. Otherwise, you must leave the website in order to comply with government restrictions.
Why does your IP address show your location as the USA?
Please confirm whether you are a US resident or not by clicking the relevant button below. If you choose the wrong option, being a US resident, you will not be able to open an account with InstaTrade anyway.
We are sorry for any inconvenience caused by this message.

