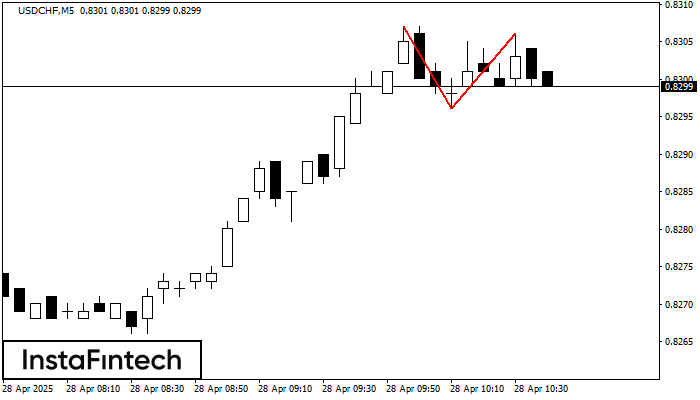
Double Top
was formed on 28.04 at 09:40:28 (UTC+0)
signal strength 1 of 5

The Double Top reversal pattern has been formed on USDCHF M5. Characteristics: the upper boundary 0.8307; the lower boundary 0.8296; the width of the pattern is 10 points. Sell trades are better to be opened below the lower boundary 0.8296 with a possible movements towards the 0.8281 level.
The M5 and M15 time frames may have more false entry points.
See Also
- All
- All
- Bearish Rectangle
- Bearish Symmetrical Triangle
- Bearish Symmetrical Triangle
- Bullish Rectangle
- Double Top
- Double Top
- Triple Bottom
- Triple Bottom
- Triple Top
- Triple Top
- All
- All
- Buy
- Sale
- All
- 1
- 2
- 3
- 4
- 5
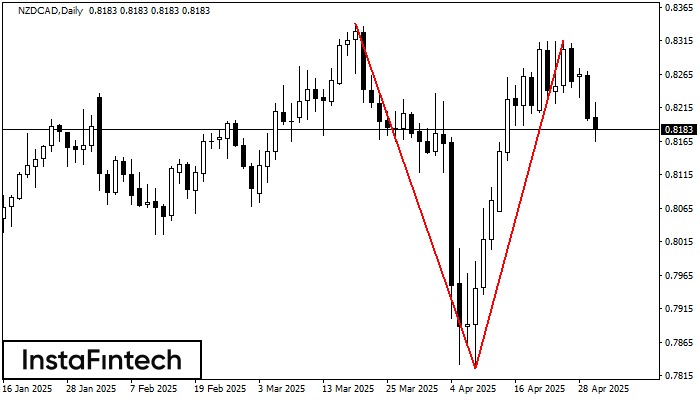
Double Top
was formed on 30.04 at 23:00:21 (UTC+0)
signal strength 5 of 5
On the chart of NZDCAD D1 the Double Top reversal pattern has been formed. Characteristics: the upper boundary 0.8316; the lower boundary 0.7826; the width of the pattern 490 points
Open chart in a new window
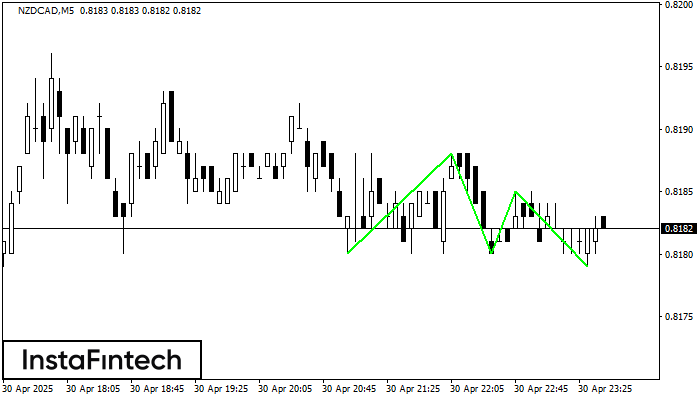
Triple Bottom
was formed on 30.04 at 22:40:20 (UTC+0)
signal strength 1 of 5
The Triple Bottom pattern has been formed on NZDCAD M5. It has the following characteristics: resistance level 0.8188/0.8185; support level 0.8180/0.8179; the width is 8 points. In the event
The M5 and M15 time frames may have more false entry points.
Open chart in a new window
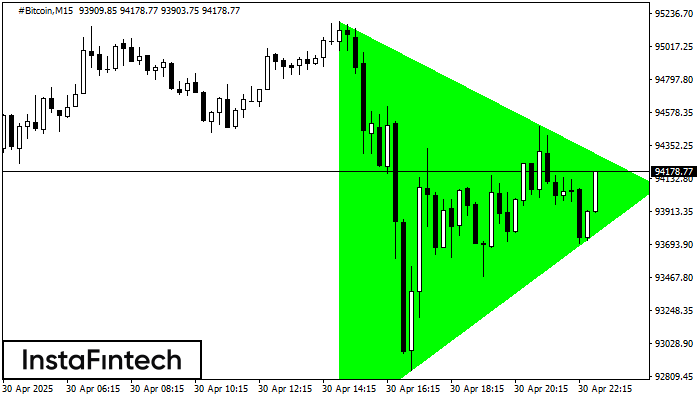
Bullish Symmetrical Triangle
was formed on 30.04 at 21:56:12 (UTC+0)
signal strength 2 of 5
According to the chart of M15, #Bitcoin formed the Bullish Symmetrical Triangle pattern. The lower border of the pattern touches the coordinates 92482.78/94081.93 whereas the upper border goes across 95186.64/94081.93
The M5 and M15 time frames may have more false entry points.
Open chart in a new window


