Actual patterns

Patterns are graphical models which are formed in the chart by the price. According to one of the technical analysis postulates, history (price movement) repeats itself. It means that the price movements are often similar in the same situations which makes it possible to predict the further development of the situation with a high probability.
Relevant patterns by InstaTrade is an easy-to-use service which allows you to be aware of latest changes in the market and react to clues from the market in time. In our service you will always find the latest and most relevant patterns on any pair and any timeframe.
Double Bottom
was formed on 24.04 at 04:31:17 (UTC+0)
signal strength 2 of 5
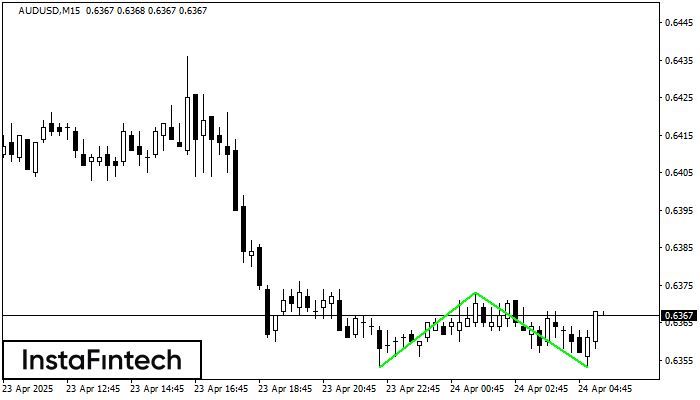
The Double Bottom pattern has been formed on AUDUSD M15; the upper boundary is 0.6373; the lower boundary is 0.6353. The width of the pattern is 20 points. In case of a break of the upper boundary 0.6373, a change in the trend can be predicted where the width of the pattern will coincide with the distance to a possible take profit level.
The M5 and M15 time frames may have more false entry points.
See Also
- All
- All
- Bearish Rectangle
- Bearish Symmetrical Triangle
- Bearish Symmetrical Triangle
- Bullish Rectangle
- Double Top
- Double Top
- Triple Bottom
- Triple Bottom
- Triple Top
- Triple Top
- All
- All
- Buy
- Sale
- All
- 1
- 2
- 3
- 4
- 5
Doble Piso
was formed on 01.05 at 23:15:27 (UTC+0)
signal strength 1 of 5
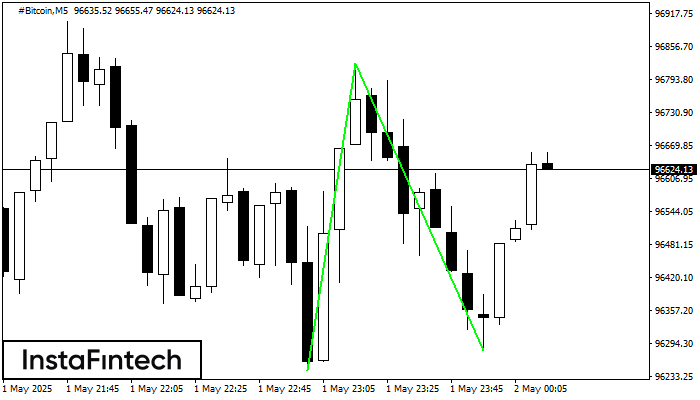
El patrón Doble Piso ha sido formado en #Bitcoin M5. Esta formación señala una reversión de la tendencia de bajista a alcista. La señal es que se debe abrir
Los marcos de tiempo M5 y M15 pueden tener más puntos de entrada falsos.
Open chart in a new window
Cabeza y Hombros
was formed on 01.05 at 23:15:24 (UTC+0)
signal strength 1 of 5
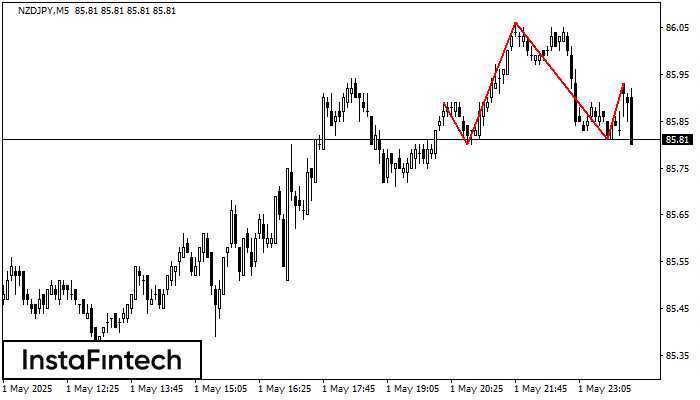
El patrón técnico llamado Cabeza y Hombros ha aparecido en el gráfico de NZDJPY M5. Existen razones poderosas para sugerir que el precio superará la línea de cuello 85.80/85.81 después
Los marcos de tiempo M5 y M15 pueden tener más puntos de entrada falsos.
Open chart in a new window
Rectángulo Bajista
was formed on 01.05 at 22:26:57 (UTC+0)
signal strength 2 of 5
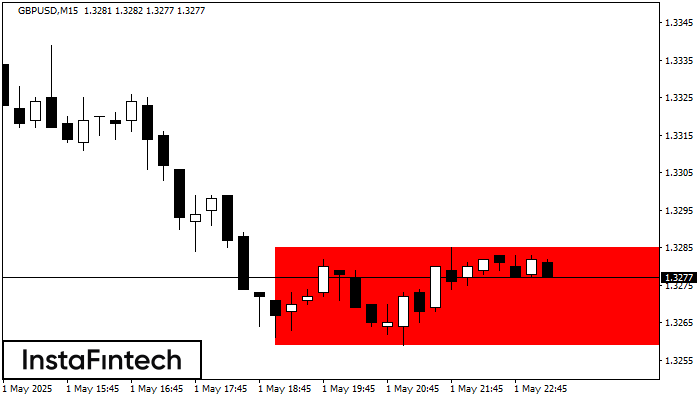
Según el gráfico de M15, GBPUSD formó el Rectángulo Bajista. El patrón indica la continuación de una tendencia. El límite superior es 1.3285, el límite inferior es 1.3259. La señal
Los marcos de tiempo M5 y M15 pueden tener más puntos de entrada falsos.
Open chart in a new window