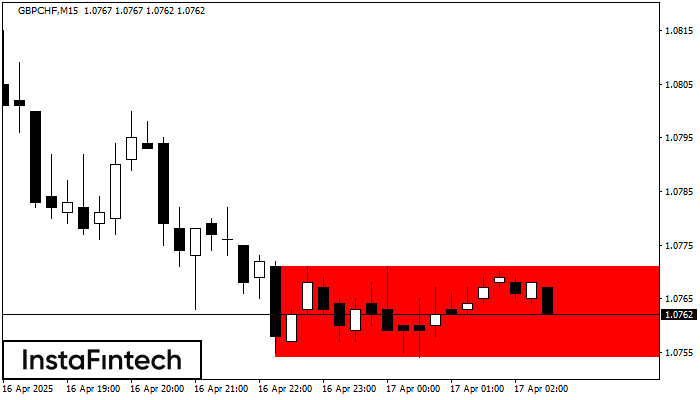
Bearish Rectangle
was formed on 17.04 at 01:35:04 (UTC+0)
signal strength 2 of 5

According to the chart of M15, GBPCHF formed the Bearish Rectangle. The pattern indicates a trend continuation. The upper border is 1.0771, the lower border is 1.0754. The signal means that a short position should be opened after fixing a price below the lower border 1.0754 of the Bearish Rectangle.
The M5 and M15 time frames may have more false entry points.
See Also
- All
- All
- Bearish Rectangle
- Bearish Symmetrical Triangle
- Bearish Symmetrical Triangle
- Bullish Rectangle
- Double Top
- Double Top
- Triple Bottom
- Triple Bottom
- Triple Top
- Triple Top
- All
- All
- Buy
- Sale
- All
- 1
- 2
- 3
- 4
- 5
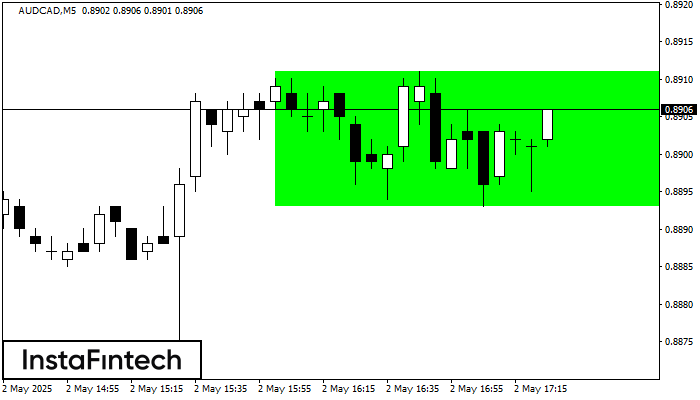
Persegi Bullish
was formed on 02.05 at 16:26:31 (UTC+0)
signal strength 1 of 5
Menurut grafik dari M5, AUDCAD terbentuk Persegi Bullish. Jenis pola ini menunjukkan kelanjutan tren. Terdiri dari dua tingkat: resistance 0.8911 dan support 0.8893. Jika level resistance 0.8911 - 0.8911 ditembus
Rangka waktu M5 dan M15 mungkin memiliki lebih dari titik entri yang keliru.
Open chart in a new window
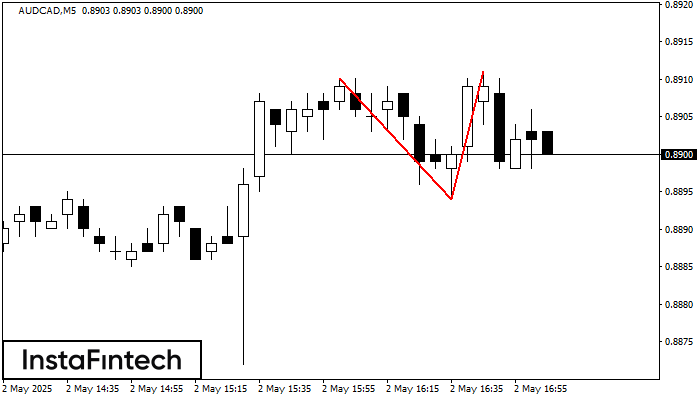
Teratas Ganda
was formed on 02.05 at 16:05:28 (UTC+0)
signal strength 1 of 5
Pada grafik AUDCAD M5 pola reversal Teratas Ganda telah terbentuk. Karakteristik: batas atas 0.8911; batas bawah 0.8894; lebar pola 17 poin. Sinyal: tembusan ke batas bawah akan menyebabkan kelanjutan tren
Rangka waktu M5 dan M15 mungkin memiliki lebih dari titik entri yang keliru.
Open chart in a new window
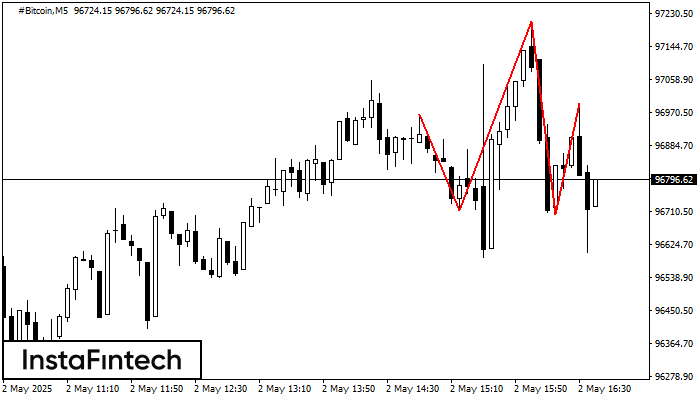
Kepala dan bahu
was formed on 02.05 at 15:40:20 (UTC+0)
signal strength 1 of 5
Pola teknikal yang disebut Kepala dan bahu telah muncul pada grafik #Bitcoin M5. Terdapat banyak alasan untuk harga melewati Neckline 96714.23/96704.41 setelah Shoulder kanan terbentuk. Jadi, tren akan berubah dengan
Rangka waktu M5 dan M15 mungkin memiliki lebih dari titik entri yang keliru.
Open chart in a new window


