

Actual patterns

Patterns are graphical models which are formed in the chart by the price. According to one of the technical analysis postulates, history (price movement) repeats itself. It means that the price movements are often similar in the same situations which makes it possible to predict the further development of the situation with a high probability.
Relevant patterns by InstaTrade is an easy-to-use service which allows you to be aware of latest changes in the market and react to clues from the market in time. In our service you will always find the latest and most relevant patterns on any pair and any timeframe.
Double Top
was formed on 16.04 at 20:30:32 (UTC+0)
signal strength 4 of 5

On the chart of #KO H1 the Double Top reversal pattern has been formed. Characteristics: the upper boundary 72.67; the lower boundary 71.72; the width of the pattern 95 points. The signal: a break of the lower boundary will cause continuation of the downward trend targeting the 71.32 level.
- All
- All
- Bearish Rectangle
- Bearish Symmetrical Triangle
- Bearish Symmetrical Triangle
- Bullish Rectangle
- Double Top
- Double Top
- Triple Bottom
- Triple Bottom
- Triple Top
- Triple Top
- All
- All
- Buy
- Sale
- All
- 1
- 2
- 3
- 4
- 5
डबल टॉप
was formed on 02.05 at 03:00:24 (UTC+0)
signal strength 2 of 5
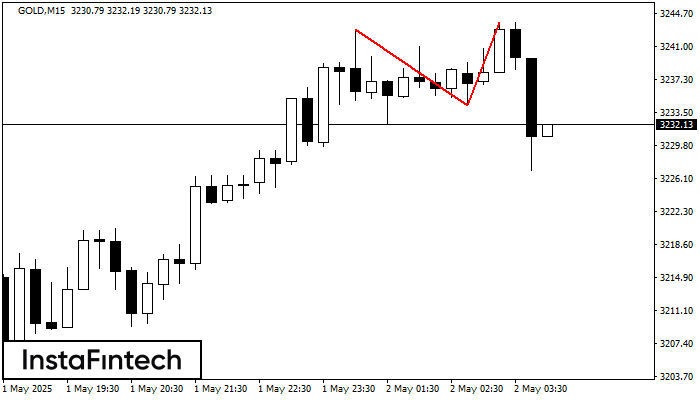
GOLD M15 के चार्ट पर डबल टॉप रीवर्सल पैटर्न बना है। विशेषताएं: ऊपरी सीमा 3243.76; निचली सीमा 3234.33; पैटर्न की चौड़ाई 943 पॉइंट्स। संकेत: निचली सीमा के टूटने से 3234.10
M5 और M15 समय सीमा में अधिक फाल्स एंट्री पॉइंट्स हो सकते हैं।
Open chart in a new window
डबल बॉटम
was formed on 02.05 at 03:00:14 (UTC+0)
signal strength 1 of 5
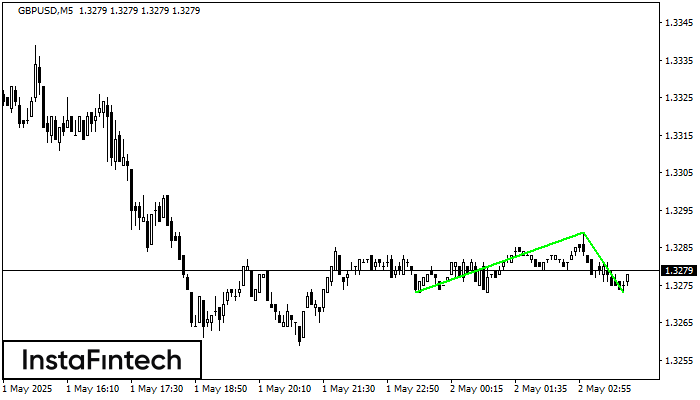
डबल बॉटम पैटर्न GBPUSD M5 पर बना है। यह फॉर्मेशन नीचे से ऊपर की ओर प्रवृत्ति के उलट होने का संकेत देता है। संकेत यह है कि पैटर्न 1.3289 की
M5 और M15 समय सीमा में अधिक फाल्स एंट्री पॉइंट्स हो सकते हैं।
Open chart in a new window
बुलिश फ्लैग
was formed on 02.05 at 02:50:29 (UTC+0)
signal strength 1 of 5
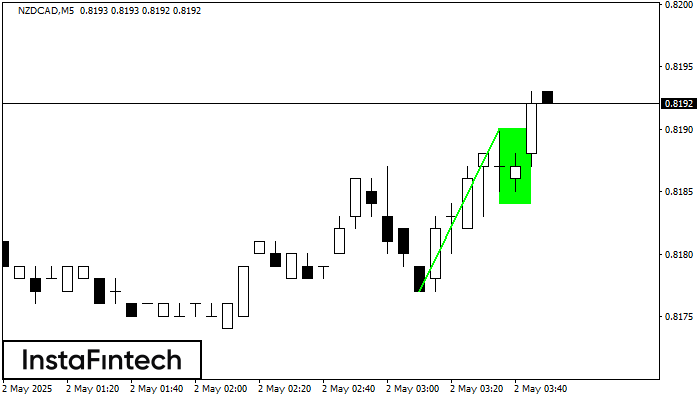
बुलिश फ्लैग पैटर्न NZDCAD पर M5 पर बना है। पैटर्न की निचली सीमा 0.8184/0.8184 पर स्थित है, जबकि उच्च सीमा 0.8190/0.8190 पर स्थित है। फ्लैगपोल का प्रक्षेपण 13 पॉइंट्स
M5 और M15 समय सीमा में अधिक फाल्स एंट्री पॉइंट्स हो सकते हैं।
Open chart in a new window


