

Actual patterns

Patterns are graphical models which are formed in the chart by the price. According to one of the technical analysis postulates, history (price movement) repeats itself. It means that the price movements are often similar in the same situations which makes it possible to predict the further development of the situation with a high probability.
Relevant patterns by InstaTrade is an easy-to-use service which allows you to be aware of latest changes in the market and react to clues from the market in time. In our service you will always find the latest and most relevant patterns on any pair and any timeframe.
Bullish Symmetrical Triangle
was formed on 16.04 at 13:16:42 (UTC+0)
signal strength 1 of 5
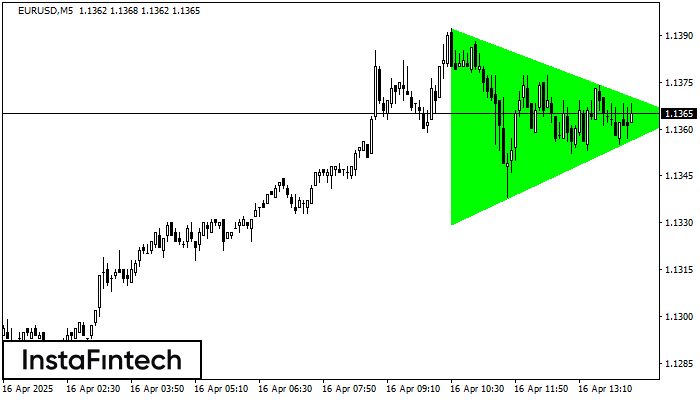
According to the chart of M5, EURUSD formed the Bullish Symmetrical Triangle pattern, which signals the trend will continue. Description. The upper border of the pattern touches the coordinates 1.1392/1.1364 whereas the lower border goes across 1.1330/1.1364. The pattern width is measured on the chart at 62 pips. If the Bullish Symmetrical Triangle pattern is in progress during the upward trend, this indicates the current trend will go on. In case 1.1364 is broken, the price could continue its move toward 1.1379.
The M5 and M15 time frames may have more false entry points.
- All
- All
- Bearish Rectangle
- Bearish Symmetrical Triangle
- Bearish Symmetrical Triangle
- Bullish Rectangle
- Double Top
- Double Top
- Triple Bottom
- Triple Bottom
- Triple Top
- Triple Top
- All
- All
- Buy
- Sale
- All
- 1
- 2
- 3
- 4
- 5
Teratas Ganda
was formed on 02.05 at 21:50:15 (UTC+0)
signal strength 1 of 5

Pola reversal Teratas Ganda telah terbentuk pada USDJPY M5. Karakteristik: batas atas 145.09; batas bawah 144.90; lebar pola 18 poin. Transaksi jual lebih baik dibuka di bawah batas bawah 144.90
Rangka waktu M5 dan M15 mungkin memiliki lebih dari titik entri yang keliru.
Open chart in a new window
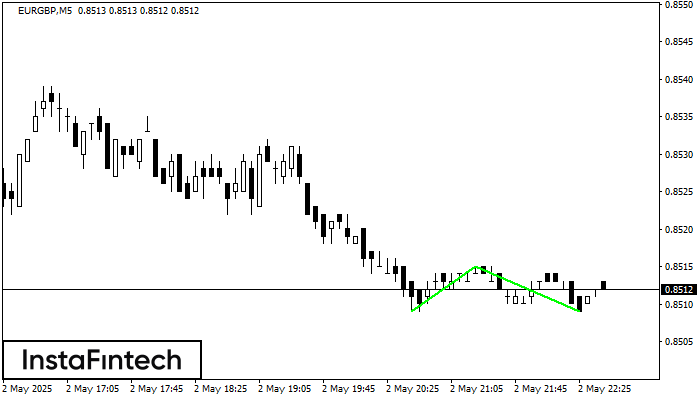
Bawah Triple
was formed on 02.05 at 21:45:21 (UTC+0)
signal strength 1 of 5

Pola Bawah Triple telah terbentuk pada EURGBP M5. Pola tersebut memiliki karakteristik sebagai berikut: level resistance 0.8515/0.8514; level support 0.8509/0.8509; dengan lebar 6 poin. Jika terjadi pemecahan (breakdown) pada level
Rangka waktu M5 dan M15 mungkin memiliki lebih dari titik entri yang keliru.
Open chart in a new window
Bawah Ganda
was formed on 02.05 at 21:40:51 (UTC+0)
signal strength 1 of 5
Pola Bawah Ganda telah terbentuk pada EURGBP M5; batas atas di 0.8515; batas bawah di 0.8509. Lebar pola sebesar 6 poin. Jika harga menembus batas atas 0.8515, Perubahan dalam tren
Rangka waktu M5 dan M15 mungkin memiliki lebih dari titik entri yang keliru.
Open chart in a new window


