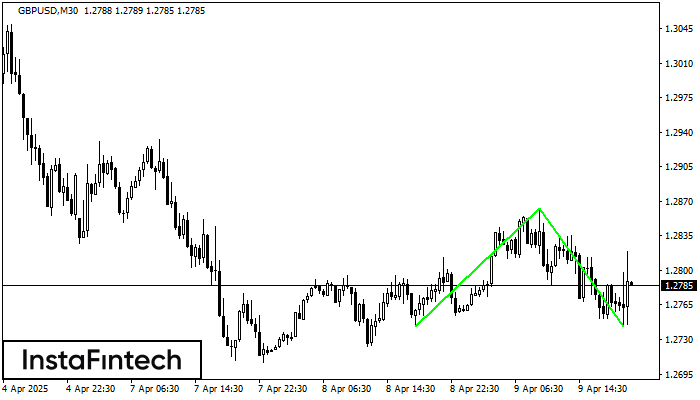
Double Bottom
was formed on 09.04 at 20:00:11 (UTC+0)
signal strength 3 of 5

The Double Bottom pattern has been formed on GBPUSD M30. This formation signals a reversal of the trend from downwards to upwards. The signal is that a buy trade should be opened after the upper boundary of the pattern 1.2863 is broken. The further movements will rely on the width of the current pattern 120 points.
- All
- All
- Bearish Rectangle
- Bearish Symmetrical Triangle
- Bearish Symmetrical Triangle
- Bullish Rectangle
- Double Top
- Double Top
- Triple Bottom
- Triple Bottom
- Triple Top
- Triple Top
- All
- All
- Buy
- Sale
- All
- 1
- 2
- 3
- 4
- 5
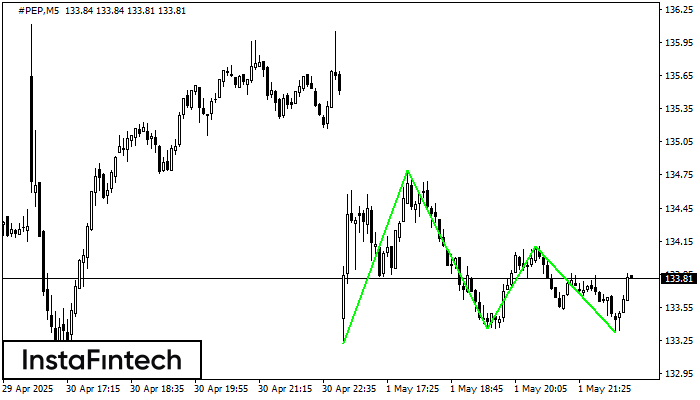
Triple Piso
was formed on 01.05 at 21:30:25 (UTC+0)
signal strength 1 of 5
El patrón Triple Piso ha sido formado en #PEP M5. Este tiene las siguientes características: nivel de resistencia 134.79/134.10; nivel de soporte 133.22/133.32; el ancho es 157 puntos. En caso
Los marcos de tiempo M5 y M15 pueden tener más puntos de entrada falsos.
Open chart in a new window
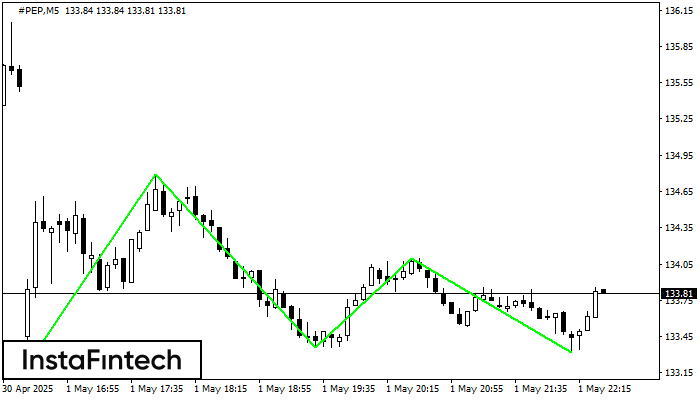
Triple Piso
was formed on 01.05 at 21:30:24 (UTC+0)
signal strength 1 of 5
El patrón Triple Piso ha sido formado en el gráfico de #PEP M5. Características del patrón: línea inferior del patrón tiene coordenadas 134.79 con el límite superior 134.79/134.10, la proyección
Los marcos de tiempo M5 y M15 pueden tener más puntos de entrada falsos.
Open chart in a new window
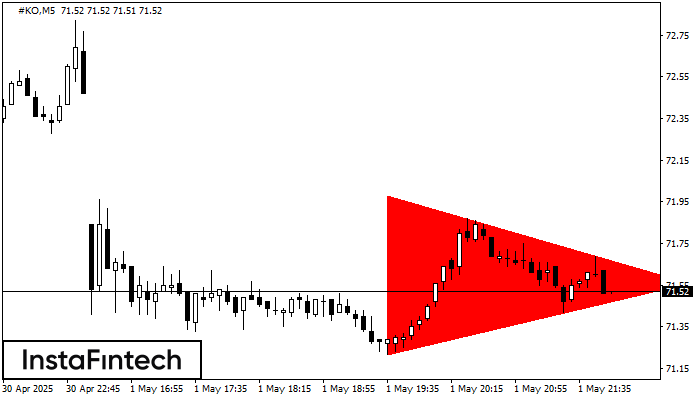
Triángulo Simétrico Bajista
was formed on 01.05 at 20:55:45 (UTC+0)
signal strength 1 of 5
Según el gráfico de M5, el #KO formó el patrón Triángulo Simétrico Bajista. Este patrón señala una tendencia bajista en caso de que el límite inferior 71.22 sea roto. Aquí
Los marcos de tiempo M5 y M15 pueden tener más puntos de entrada falsos.
Open chart in a new window


